29
/fr/
fr
AIzaSyAYiBZKx7MnpbEhh9jyipgxe19OcubqV5w
April 1, 2024
286777
Zimbabwe
ZWE
true
2
1
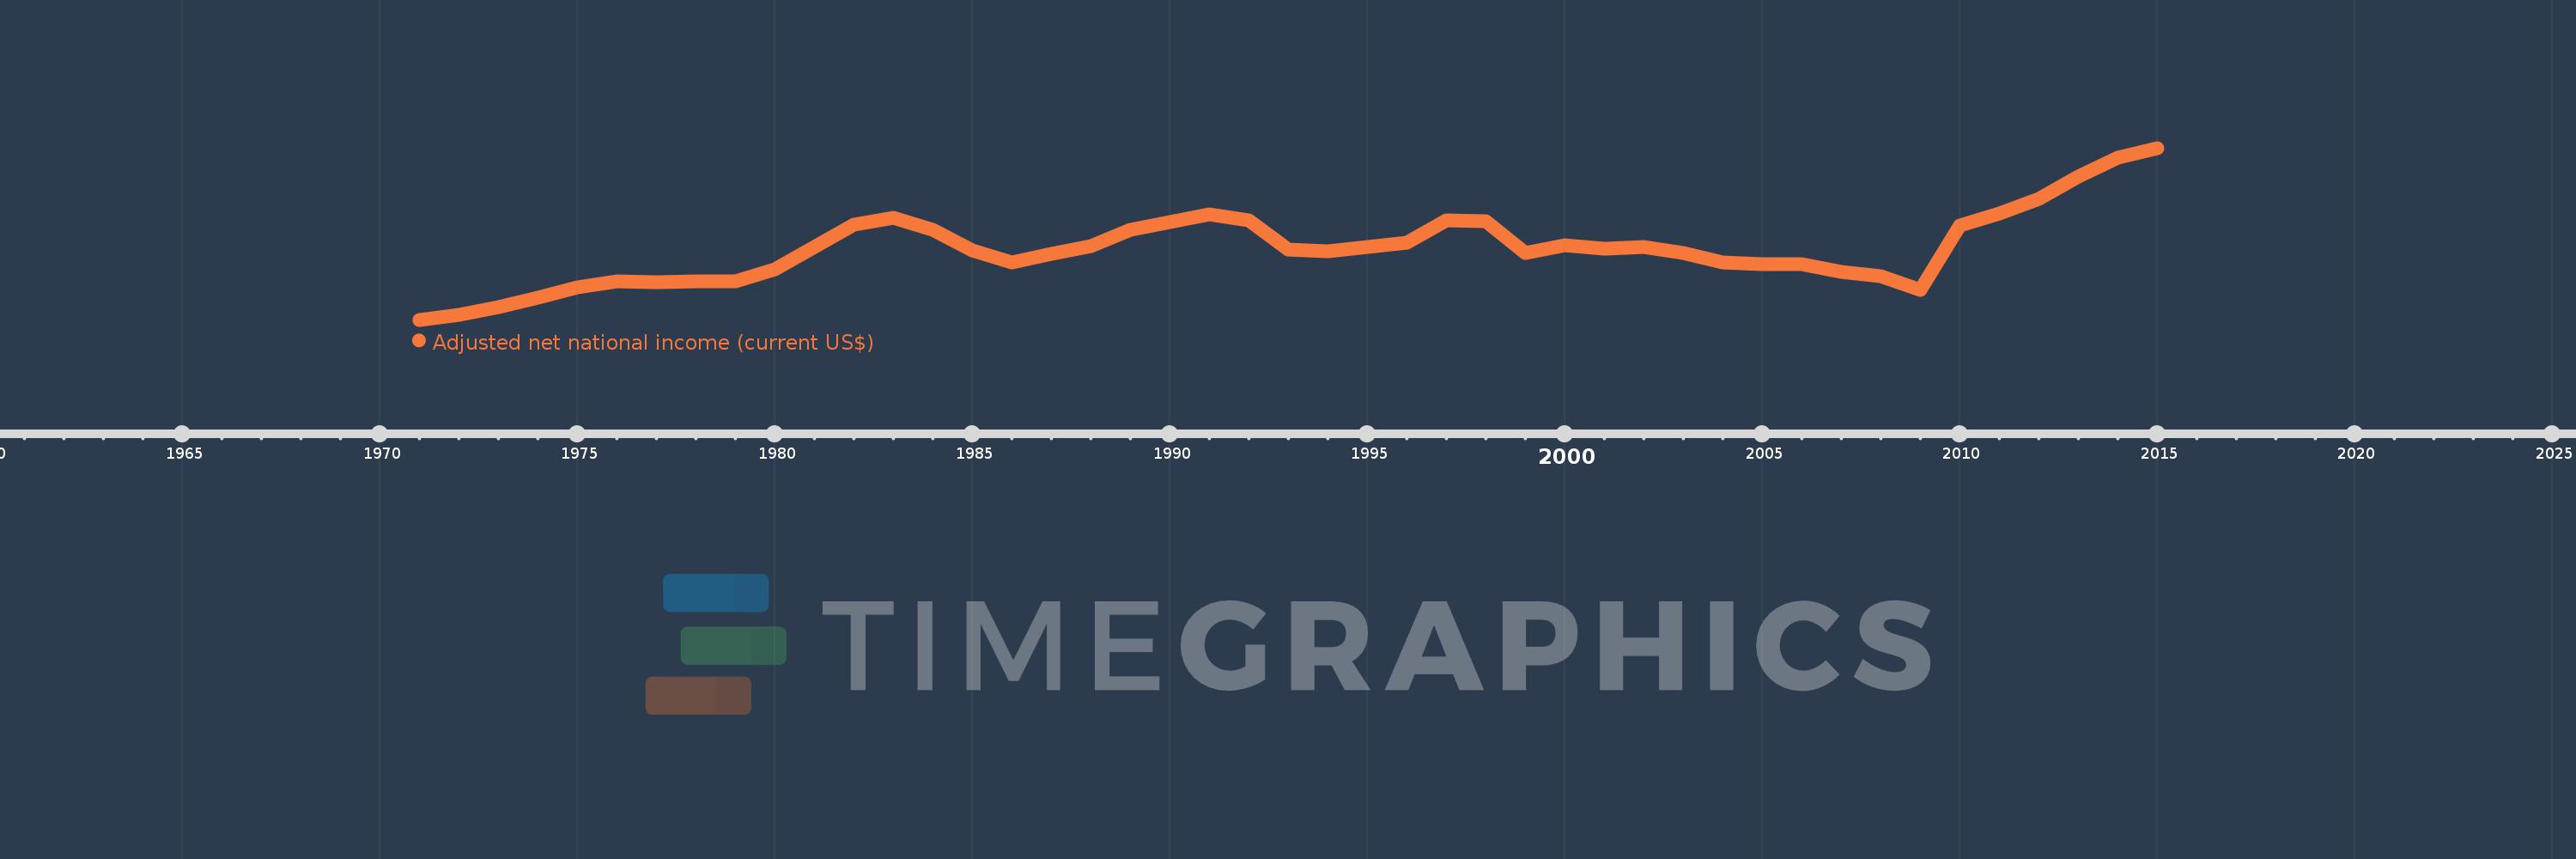
Adjusted net national income (current US$)
2015,2014,2013,2012,2011,2010,2009,2008,2007,2006,2005,2004,2003,2002,2001,2000,1999,1998,1997,1996,1995,1994,1993,1992,1991,1990,1989,1988,1987,1986,1985,1984,1983,1982,1981,1980,1979,1978,1977,1976,1975,1974,1973,1972,1971
Cette statistique dans les autres pays:
AfghanistanAlbaniaAlgeriaAngolaArab WorldArgentinaArmeniaAustraliaAustriaAzerbaijanBahamas, TheBahrainBangladeshBarbadosBelarusBelgiumBelizeBeninBhutanBoliviaBotswanaBrazilBrunei DarussalamBulgariaBurkina FasoBurundiCabo VerdeCambodiaCameroonCanadaCaribbean small statesCentral African RepublicCentral Europe and the BalticsChadChileChinaColombiaComorosCongo, Dem. Rep.Congo, Rep.Costa RicaCote d'IvoireCroatiaCubaCyprusCzech RepublicDenmarkDjiboutiDominicaDominican RepublicEarly-demographic dividendEast Asia & PacificEast Asia & Pacific (excluding high income)East Asia & Pacific (IDA & IBRD countries)EcuadorEgypt, Arab Rep.El SalvadorEquatorial GuineaEritreaEstoniaEthiopiaEuro areaEurope & Central AsiaEurope & Central Asia (excluding high income)Europe & Central Asia (IDA & IBRD countries)European UnionFijiFinlandFragile and conflict affected situationsFranceGabonGambia, TheGeorgiaGermanyGhanaGreeceGuatemalaGuineaGuinea-BissauGuyanaHaitiHeavily indebted poor countries (HIPC)High incomeHondurasHong Kong SAR, ChinaHungaryIBRD onlyIcelandIDA & IBRD totalIDA blendIDA onlyIDA totalIndiaIndonesiaIran, Islamic Rep.IraqIrelandIsraelItalyJamaicaJapanJordanKazakhstanKenyaKiribatiKorea, Rep.KuwaitKyrgyz RepublicLao PDRLate-demographic dividendLatin America & Caribbean Latin America & Caribbean (excluding high income)Latin America & the Caribbean (IDA & IBRD countries)LatviaLeast developed countries: UN classificationLebanonLesothoLiberiaLibyaLithuaniaLow & middle incomeLow incomeLower middle incomeLuxembourgMacedonia, FYRMadagascarMalawiMalaysiaMaldivesMaliMauritaniaMauritiusMexicoMiddle East & North AfricaMiddle East & North Africa (excluding high income)Middle East & North Africa (IDA & IBRD countries)Middle incomeMoldovaMongoliaMoroccoMozambiqueMyanmarNamibiaNepalNetherlandsNew ZealandNicaraguaNigerNigeriaNorth AmericaNorwayOECD membersOmanOther small statesPacific island small statesPakistanPanamaPapua New GuineaParaguayPeruPhilippinesPolandPortugalPost-demographic dividendPre-demographic dividendQatarRomaniaRussian FederationRwandaSamoaSao Tome and PrincipeSaudi ArabiaSenegalSeychellesSierra LeoneSingaporeSlovak RepublicSloveniaSmall statesSolomon IslandsSouth AfricaSouth AsiaSouth Asia (IDA & IBRD)SpainSri LankaSt. LuciaSt. Vincent and the GrenadinesSub-Saharan Africa Sub-Saharan Africa (excluding high income)Sub-Saharan Africa (IDA & IBRD countries)SudanSurinameSwazilandSwedenSwitzerlandSyrian Arab RepublicTajikistanTanzaniaThailandTogoTongaTrinidad and TobagoTunisiaTurkeyTurkmenistanUgandaUkraineUnited Arab EmiratesUnited KingdomUnited StatesUpper middle incomeUruguayUzbekistanVanuatuVenezuela, RBVietnamWorldYemen, Rep.ZambiaZimbabwe La ligne de temps
Cette échelle de temps montre un graphique de 1971 année à 2015 année Zimbabwe. Les données jusqu'à 1970 année ne sont pas présentés. Quantité d'observations actuelles selon dates: 45.
Source (désignation):
Les indicateurs du développement mondiale
Source (organisation):
World Bank staff estimates based on sources and methods in World Bank's "The Changing Wealth of Nations: Measuring Sustainable Development in the New Millennium" (2011).
Catégories:
Economy & Growth
Dernière mise à jour
23 avr. 2017
Les indicateurs de changement de valeurs selon les années
Minimum:
1.837 mds
1 janv. 1971
Maximum:
12.543 mds
1 janv. 2015
Pour la date d''observation
Valeur
Changement absolu
Le changement par rapport à la valeur précédente
1 janv. 1971
1.837 mds
+1.837 mds
0.0%
1 janv. 1972
2.12 mds
+283.367 mln.
15.43%
1 janv. 1973
2.611 mds
+491.074 mln.
23.16%
1 janv. 1974
3.235 mds
+623.332 mln.
23.87%
1 janv. 1975
3.88 mds
+645.55 mln.
19.96%
1 janv. 1976
4.246 mds
+365.488 mln.
9.42%
1 janv. 1977
4.166 mds
-79.496 mln.
-1.87%
1 janv. 1978
4.205 mds
+38.713 mln.
0.93%
1 janv. 1979
4.226 mds
+21.528 mln.
0.51%
1 janv. 1980
4.995 mds
+768.591 mln.
18.19%
1 janv. 1981
6.366 mds
+1.371 mds
27.44%
1 janv. 1982
7.736 mds
+1.371 mds
21.53%
1 janv. 1983
8.186 mds
+449.116 mln.
5.81%
1 janv. 1984
7.45 mds
-735.309 mln.
-8.98%
1 janv. 1985
6.136 mds
-1.314 mds
-17.64%
1 janv. 1986
5.427 mds
-709.088 mln.
-11.56%
1 janv. 1987
5.964 mds
+537.314 mln.
9.9%
1 janv. 1988
6.45 mds
+485.778 mln.
8.14%
1 janv. 1989
7.416 mds
+965.771 mln.
14.97%
1 janv. 1990
7.908 mds
+492.026 mln.
6.63%
1 janv. 1991
8.397 mds
+489.464 mln.
6.19%
1 janv. 1992
8.044 mds
-353.193 mln.
-4.21%
1 janv. 1993
6.232 mds
-1.812 mds
-22.52%
1 janv. 1994
6.129 mds
-103.475 mln.
-1.66%
1 janv. 1995
6.38 mds
+251.326 mln.
4.1%
1 janv. 1996
6.628 mds
+247.592 mln.
3.88%
1 janv. 1997
8.045 mds
+1.417 mds
21.38%
1 janv. 1998
7.97 mds
-75.076 mln.
-0.93%
1 janv. 1999
5.983 mds
-1.987 mds
-24.93%
1 janv. 2000
6.458 mds
+474.979 mln.
7.94%
1 janv. 2001
6.271 mds
-186.841 mln.
-2.89%
1 janv. 2002
6.388 mds
+116.301 mln.
1.85%
1 janv. 2003
6.002 mds
-385.462 mln.
-6.03%
1 janv. 2004
5.4 mds
-602.519 mln.
-10.04%
1 janv. 2005
5.311 mds
-88.786 mln.
-1.64%
1 janv. 2006
5.288 mds
-22.663 mln.
-0.43%
1 janv. 2007
4.843 mds
-445.613 mln.
-8.43%
1 janv. 2008
4.532 mds
-310.832 mln.
-6.42%
1 janv. 2009
3.706 mds
-825.636 mln.
-18.22%
1 janv. 2010
7.694 mds
+3.988 mds
107.6%
1 janv. 2011
8.466 mds
+772.311 mln.
10.04%
1 janv. 2012
9.382 mds
+915.606 mln.
10.81%
1 janv. 2013
10.741 mds
+1.359 mds
14.49%
1 janv. 2014
11.911 mds
+1.17 mds
10.9%
1 janv. 2015
12.543 mds
+631.256 mln.
5.3%
Classement des pays selon les statistiques actuelles par années


Commentaires: