29
/fr/
fr
AIzaSyAYiBZKx7MnpbEhh9jyipgxe19OcubqV5w
April 1, 2024
184764
Madagascar
MDG
true
2
1
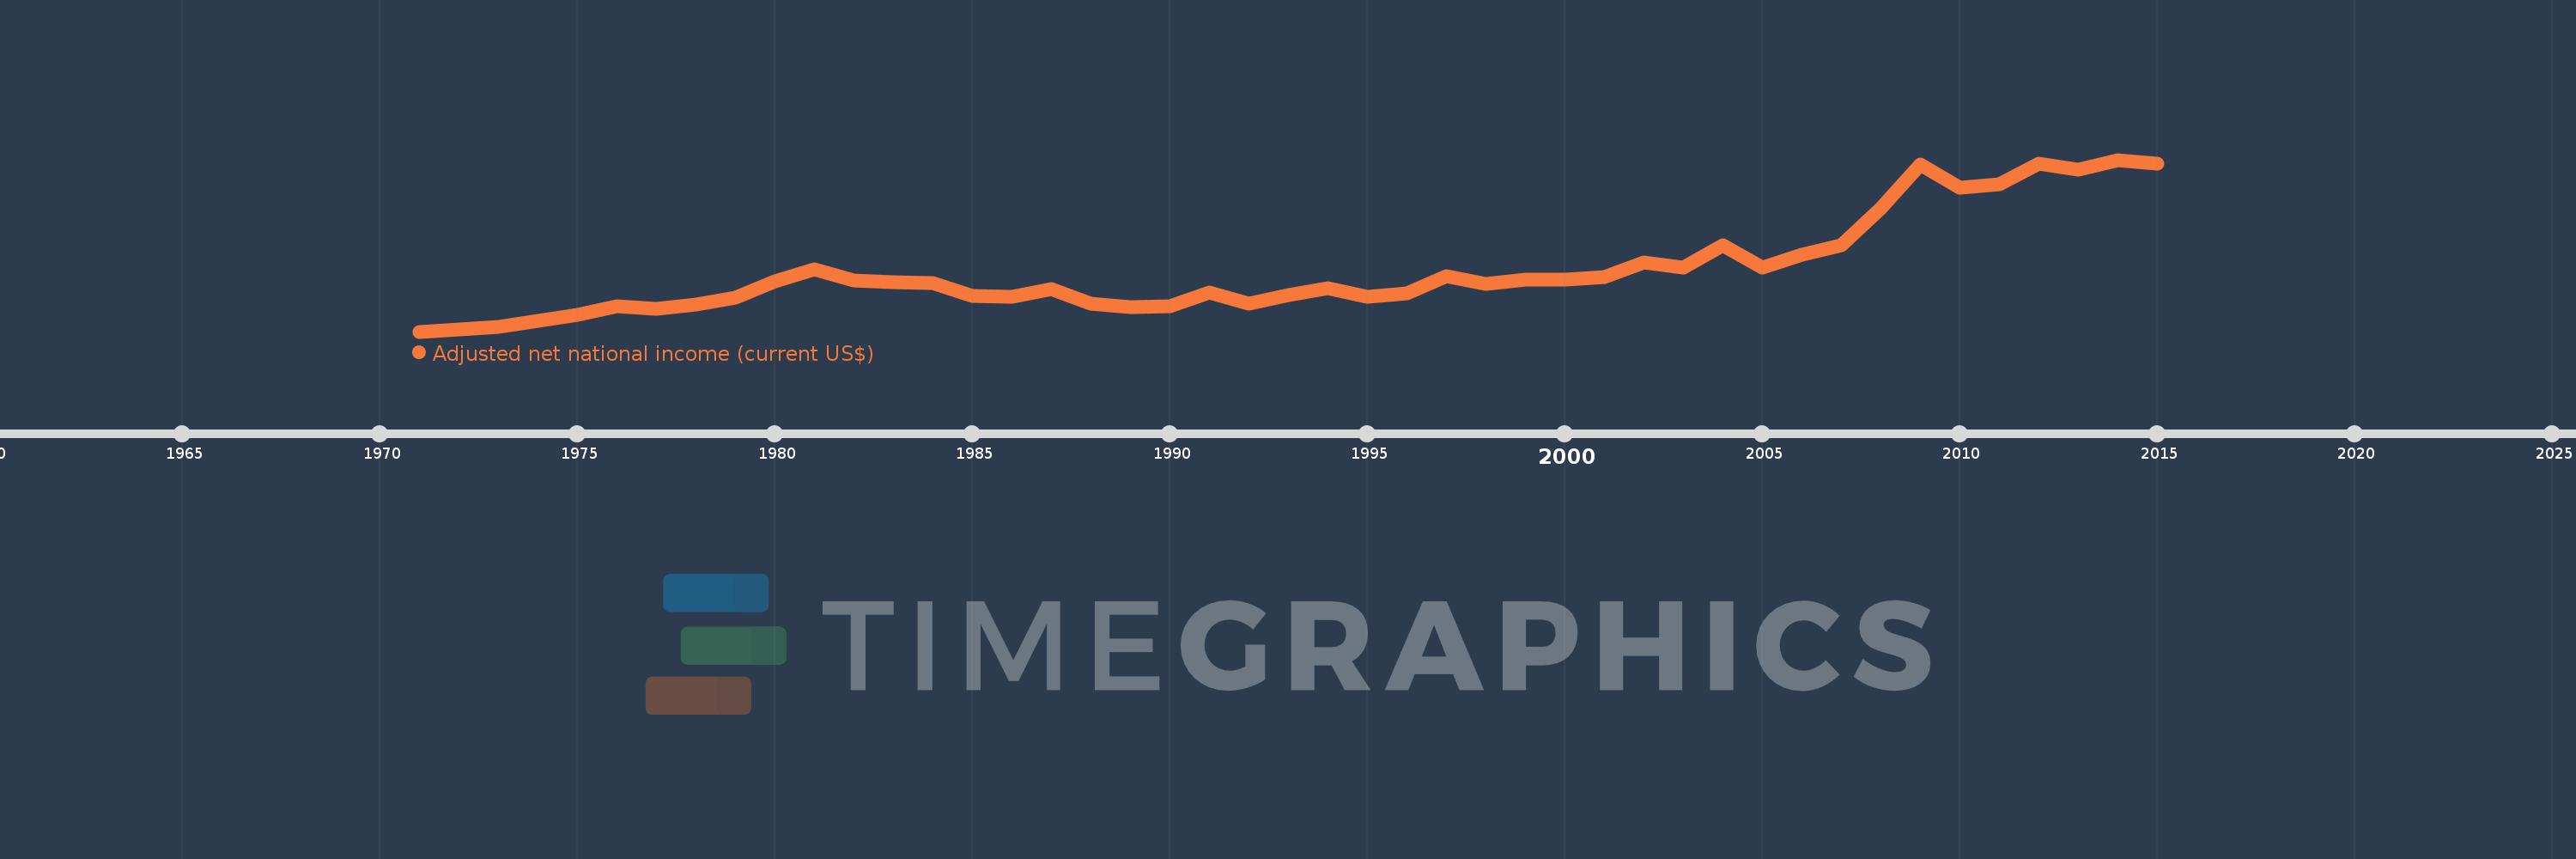
Adjusted net national income (current US$)
2015,2014,2013,2012,2011,2010,2009,2008,2007,2006,2005,2004,2003,2002,2001,2000,1999,1998,1997,1996,1995,1994,1993,1992,1991,1990,1989,1988,1987,1986,1985,1984,1983,1982,1981,1980,1979,1978,1977,1976,1975,1974,1973,1972,1971
Cette statistique dans les autres pays:
AfghanistanAlbaniaAlgeriaAngolaArab WorldArgentinaArmeniaAustraliaAustriaAzerbaijanBahamas, TheBahrainBangladeshBarbadosBelarusBelgiumBelizeBeninBhutanBoliviaBotswanaBrazilBrunei DarussalamBulgariaBurkina FasoBurundiCabo VerdeCambodiaCameroonCanadaCaribbean small statesCentral African RepublicCentral Europe and the BalticsChadChileChinaColombiaComorosCongo, Dem. Rep.Congo, Rep.Costa RicaCote d'IvoireCroatiaCubaCyprusCzech RepublicDenmarkDjiboutiDominicaDominican RepublicEarly-demographic dividendEast Asia & PacificEast Asia & Pacific (excluding high income)East Asia & Pacific (IDA & IBRD countries)EcuadorEgypt, Arab Rep.El SalvadorEquatorial GuineaEritreaEstoniaEthiopiaEuro areaEurope & Central AsiaEurope & Central Asia (excluding high income)Europe & Central Asia (IDA & IBRD countries)European UnionFijiFinlandFragile and conflict affected situationsFranceGabonGambia, TheGeorgiaGermanyGhanaGreeceGuatemalaGuineaGuinea-BissauGuyanaHaitiHeavily indebted poor countries (HIPC)High incomeHondurasHong Kong SAR, ChinaHungaryIBRD onlyIcelandIDA & IBRD totalIDA blendIDA onlyIDA totalIndiaIndonesiaIran, Islamic Rep.IraqIrelandIsraelItalyJamaicaJapanJordanKazakhstanKenyaKiribatiKorea, Rep.KuwaitKyrgyz RepublicLao PDRLate-demographic dividendLatin America & Caribbean Latin America & Caribbean (excluding high income)Latin America & the Caribbean (IDA & IBRD countries)LatviaLeast developed countries: UN classificationLebanonLesothoLiberiaLibyaLithuaniaLow & middle incomeLow incomeLower middle incomeLuxembourgMacedonia, FYRMadagascarMalawiMalaysiaMaldivesMaliMauritaniaMauritiusMexicoMiddle East & North AfricaMiddle East & North Africa (excluding high income)Middle East & North Africa (IDA & IBRD countries)Middle incomeMoldovaMongoliaMoroccoMozambiqueMyanmarNamibiaNepalNetherlandsNew ZealandNicaraguaNigerNigeriaNorth AmericaNorwayOECD membersOmanOther small statesPacific island small statesPakistanPanamaPapua New GuineaParaguayPeruPhilippinesPolandPortugalPost-demographic dividendPre-demographic dividendQatarRomaniaRussian FederationRwandaSamoaSao Tome and PrincipeSaudi ArabiaSenegalSeychellesSierra LeoneSingaporeSlovak RepublicSloveniaSmall statesSolomon IslandsSouth AfricaSouth AsiaSouth Asia (IDA & IBRD)SpainSri LankaSt. LuciaSt. Vincent and the GrenadinesSub-Saharan Africa Sub-Saharan Africa (excluding high income)Sub-Saharan Africa (IDA & IBRD countries)SudanSurinameSwazilandSwedenSwitzerlandSyrian Arab RepublicTajikistanTanzaniaThailandTogoTongaTrinidad and TobagoTunisiaTurkeyTurkmenistanUgandaUkraineUnited Arab EmiratesUnited KingdomUnited StatesUpper middle incomeUruguayUzbekistanVanuatuVenezuela, RBVietnamWorldYemen, Rep.ZambiaZimbabwe La ligne de temps
Cette échelle de temps montre un graphique de 1971 année à 2015 année Madagascar. Les données jusqu'à 1970 année ne sont pas présentés. Quantité d'observations actuelles selon dates: 45.
Source (désignation):
Les indicateurs du développement mondiale
Source (organisation):
World Bank staff estimates based on sources and methods in World Bank's "The Changing Wealth of Nations: Measuring Sustainable Development in the New Millennium" (2011).
Catégories:
Economy & Growth
Dernière mise à jour
23 avr. 2017
Les indicateurs de changement de valeurs selon les années
Minimum:
1.067 mds
1 janv. 1971
Maximum:
9.066 mds
1 janv. 2014
Pour la date d''observation
Valeur
Changement absolu
Le changement par rapport à la valeur précédente
1 janv. 1971
1.067 mds
+1.067 mds
0.0%
1 janv. 1972
1.15 mds
+83.379 mln.
7.82%
1 janv. 1973
1.286 mds
+135.78 mln.
11.81%
1 janv. 1974
1.579 mds
+293.519 mln.
22.83%
1 janv. 1975
1.846 mds
+266.575 mln.
16.88%
1 janv. 1976
2.227 mds
+380.979 mln.
20.64%
1 janv. 1977
2.145 mds
-82.241 mln.
-3.69%
1 janv. 1978
2.328 mds
+183.72 mln.
8.57%
1 janv. 1979
2.635 mds
+306.48 mln.
13.16%
1 janv. 1980
3.41 mds
+775.513 mln.
29.43%
1 janv. 1981
3.962 mds
+551.43 mln.
16.17%
1 janv. 1982
3.446 mds
-515.941 mln.
-13.02%
1 janv. 1983
3.36 mds
-85.577 mln.
-2.48%
1 janv. 1984
3.331 mds
-29.213 mln.
-0.87%
1 janv. 1985
2.738 mds
-593.505 mln.
-17.82%
1 janv. 1986
2.68 mds
-57.951 mln.
-2.12%
1 janv. 1987
3.047 mds
+367.475 mln.
13.71%
1 janv. 1988
2.359 mds
-687.764 mln.
-22.57%
1 janv. 1989
2.223 mds
-136.798 mln.
-5.8%
1 janv. 1990
2.252 mds
+29.686 mln.
1.34%
1 janv. 1991
2.869 mds
+616.624 mln.
27.38%
1 janv. 1992
2.356 mds
-512.429 mln.
-17.86%
1 janv. 1993
2.752 mds
+395.813 mln.
16.8%
1 janv. 1994
3.082 mds
+329.52 mln.
11.97%
1 janv. 1995
2.679 mds
-402.875 mln.
-13.07%
1 janv. 1996
2.84 mds
+160.696 mln.
6.0%
1 janv. 1997
3.633 mds
+793.681 mln.
27.95%
1 janv. 1998
3.274 mds
-359.563 mln.
-9.9%
1 janv. 1999
3.479 mds
+205.312 mln.
6.27%
1 janv. 2000
3.492 mds
+13.0 mln.
0.37%
1 janv. 2001
3.625 mds
+133.317 mln.
3.82%
1 janv. 2002
4.273 mds
+647.198 mln.
17.85%
1 janv. 2003
4.033 mds
-239.564 mln.
-5.61%
1 janv. 2004
5.102 mds
+1.069 mds
26.51%
1 janv. 2005
4.051 mds
-1.051 mds
-20.6%
1 janv. 2006
4.665 mds
+613.661 mln.
15.15%
1 janv. 2007
5.081 mds
+416.431 mln.
8.93%
1 janv. 2008
6.824 mds
+1.743 mds
34.3%
1 janv. 2009
8.842 mds
+2.018 mds
29.57%
1 janv. 2010
7.774 mds
-1.068 mds
-12.08%
1 janv. 2011
7.91 mds
+136.147 mln.
1.75%
1 janv. 2012
8.873 mds
+963.285 mln.
12.18%
1 janv. 2013
8.609 mds
-264.502 mln.
-2.98%
1 janv. 2014
9.066 mds
+457.441 mln.
5.31%
1 janv. 2015
8.906 mds
-160.625 mln.
-1.77%
Classement des pays selon les statistiques actuelles par années


Commentaires: