29
/fr/
fr
AIzaSyAYiBZKx7MnpbEhh9jyipgxe19OcubqV5w
April 1, 2024
286501
Zambia
ZMB
true
2
1
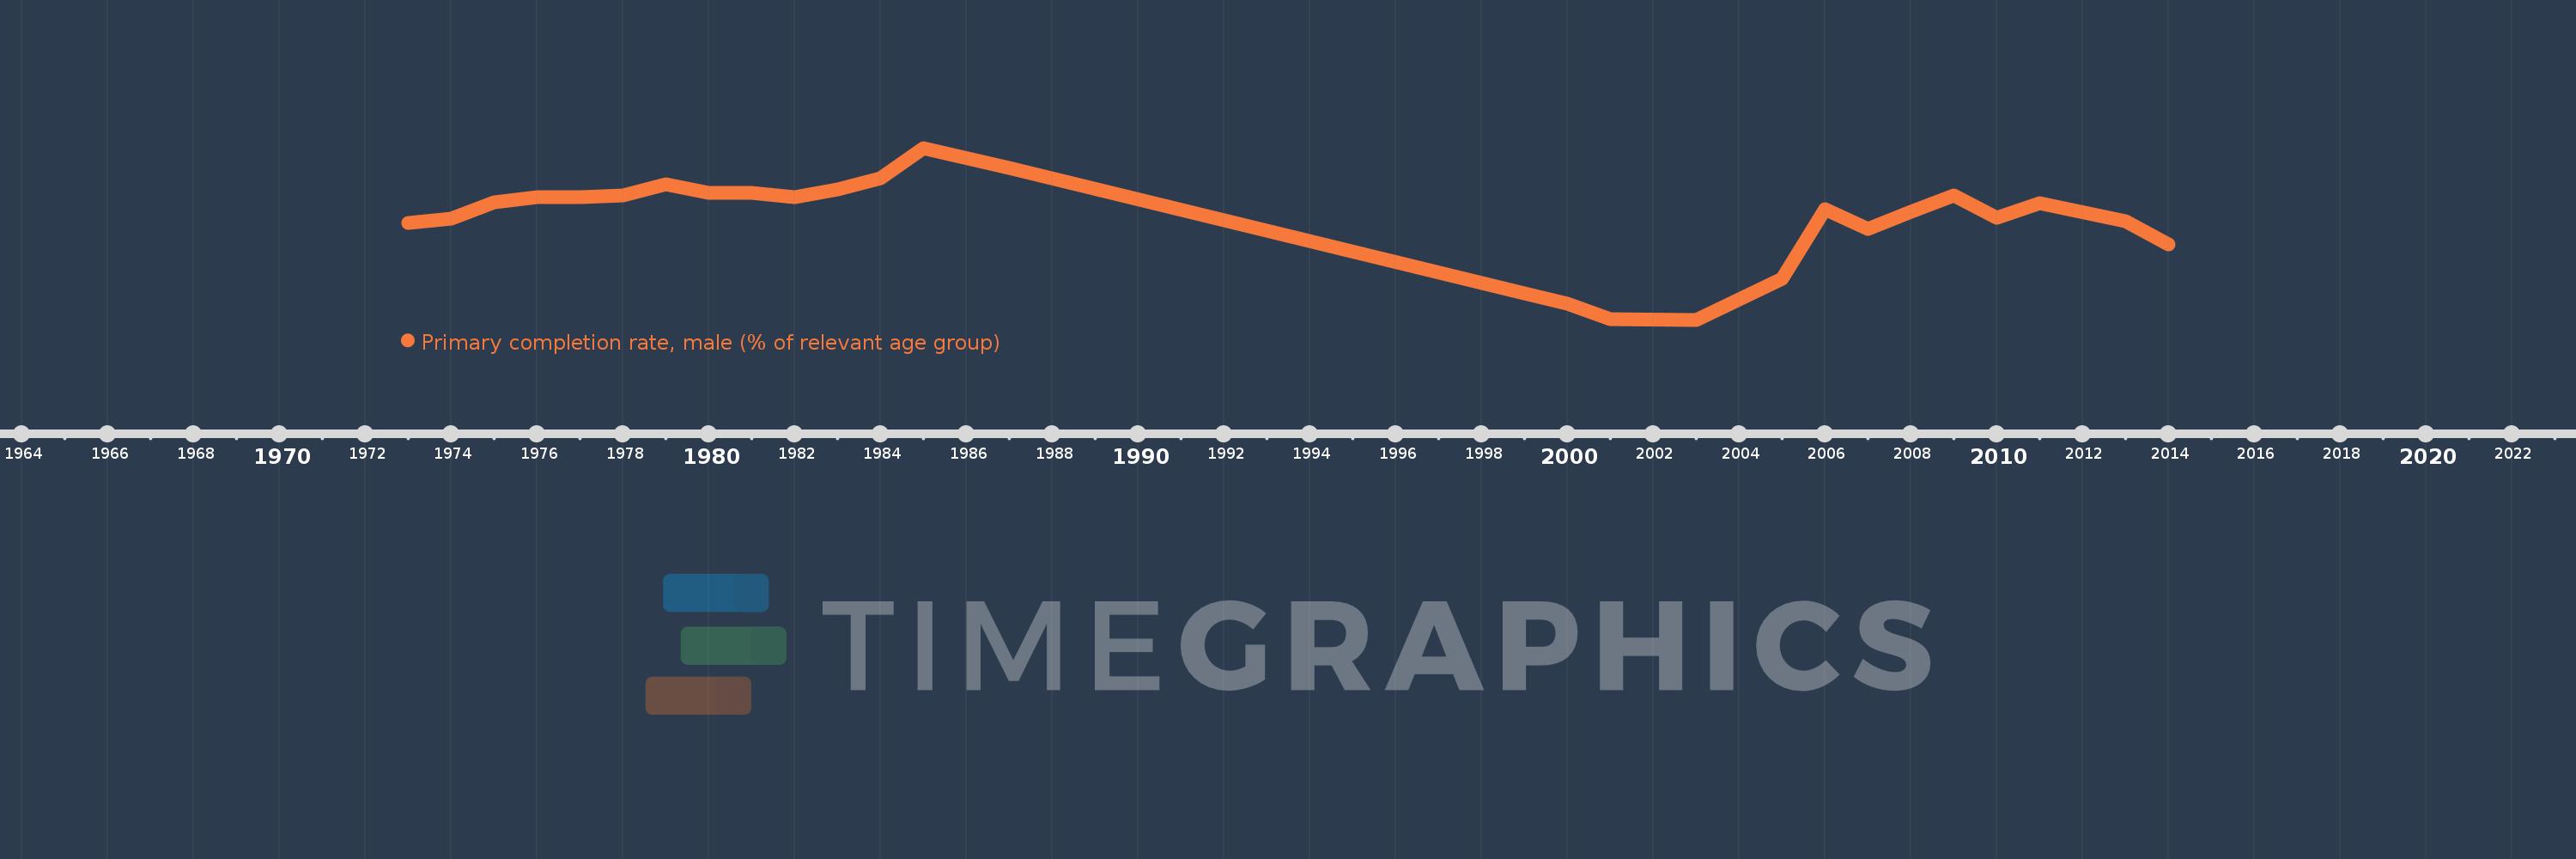
Primary completion rate, male (% of relevant age group)
2014,2013,2011,2010,2009,2008,2007,2006,2005,2003,2001,2000,1999,1987,1985,1984,1983,1982,1981,1980,1979,1978,1977,1976,1975,1974,1973
Cette statistique dans les autres pays:
AfghanistanAlbaniaAlgeriaAngolaAntigua and BarbudaArab WorldArgentinaArmeniaArubaAustriaAzerbaijanBahamas, TheBahrainBangladeshBarbadosBelarusBelgiumBelizeBeninBermudaBhutanBoliviaBosnia and HerzegovinaBotswanaBrunei DarussalamBulgariaBurkina FasoBurundiCabo VerdeCambodiaCameroonCanadaCaribbean small statesCentral African RepublicCentral Europe and the BalticsChadChileChinaColombiaComorosCongo, Dem. Rep.Congo, Rep.Costa RicaCote d'IvoireCroatiaCubaCyprusCzech RepublicDenmarkDjiboutiDominicaDominican RepublicEarly-demographic dividendEast Asia & PacificEast Asia & Pacific (excluding high income)East Asia & Pacific (IDA & IBRD countries)EcuadorEgypt, Arab Rep.El SalvadorEquatorial GuineaEritreaEstoniaEthiopiaEuro areaEurope & Central AsiaEurope & Central Asia (excluding high income)Europe & Central Asia (IDA & IBRD countries)European UnionFijiFinlandFragile and conflict affected situationsFranceGabonGambia, TheGeorgiaGermanyGhanaGreeceGrenadaGuatemalaGuineaGuinea-BissauGuyanaHaitiHeavily indebted poor countries (HIPC)High incomeHondurasHong Kong SAR, ChinaHungaryIBRD onlyIcelandIDA & IBRD totalIDA blendIDA onlyIDA totalIndiaIndonesiaIran, Islamic Rep.IraqIrelandIsraelItalyJamaicaJapanJordanKazakhstanKenyaKiribatiKorea, Dem. People’s Rep.Korea, Rep.KuwaitKyrgyz RepublicLao PDRLate-demographic dividendLatin America & Caribbean Latin America & Caribbean (excluding high income)Latin America & the Caribbean (IDA & IBRD countries)LatviaLeast developed countries: UN classificationLebanonLesothoLiberiaLibyaLiechtensteinLithuaniaLow & middle incomeLow incomeLower middle incomeLuxembourgMacao SAR, ChinaMacedonia, FYRMadagascarMalawiMaldivesMaliMaltaMarshall IslandsMauritaniaMauritiusMexicoMiddle East & North AfricaMiddle East & North Africa (excluding high income)Middle East & North Africa (IDA & IBRD countries)Middle incomeMoldovaMongoliaMontenegroMoroccoMozambiqueMyanmarNamibiaNauruNepalNetherlandsNew ZealandNicaraguaNigerNigeriaNorwayOECD membersOmanOther small statesPacific island small statesPakistanPalauPanamaPapua New GuineaParaguayPeruPhilippinesPolandPortugalPost-demographic dividendPre-demographic dividendQatarRomaniaRussian FederationRwandaSamoaSan MarinoSao Tome and PrincipeSaudi ArabiaSenegalSerbiaSeychellesSierra LeoneSlovak RepublicSloveniaSmall statesSolomon IslandsSouth AfricaSouth AsiaSouth Asia (IDA & IBRD)South SudanSpainSri LankaSt. Kitts and NevisSt. LuciaSt. Vincent and the GrenadinesSub-Saharan Africa Sub-Saharan Africa (excluding high income)Sub-Saharan Africa (IDA & IBRD countries)SudanSurinameSwazilandSwedenSwitzerlandSyrian Arab RepublicTajikistanTanzaniaThailandTimor-LesteTogoTongaTrinidad and TobagoTunisiaTurkeyTuvaluUgandaUkraineUnited Arab EmiratesUpper middle incomeUruguayUzbekistanVanuatuVenezuela, RBVietnamWest Bank and GazaWorldYemen, Rep.ZambiaZimbabwe La ligne de temps
Cette échelle de temps montre un graphique de 1973 année à 2014 année Zambia. Les données jusqu'à 1972 année ne sont pas présentés. Quantité d'observations actuelles selon dates: 27.
Source (désignation):
Les indicateurs du développement mondiale
Source (organisation):
United Nations Educational, Scientific, and Cultural Organization (UNESCO) Institute for Statistics.
Catégories:
Education, Gender
Dernière mise à jour
23 avr. 2017
Les indicateurs de changement de valeurs selon les années
Minimum:
62.154
1 janv. 2003
Maximum:
107.821
1 janv. 1985
Pour la date d''observation
Valeur
Changement absolu
Le changement par rapport à la valeur précédente
1 janv. 1973
87.909
+87.909
0.0%
1 janv. 1974
89.071
+1.162
1.32%
1 janv. 1975
93.279
+4.208
4.72%
1 janv. 1976
94.712
+1.433
1.54%
1 janv. 1977
94.651
-0.061
-0.06%
1 janv. 1978
95.119
+0.469
0.49%
1 janv. 1979
98.27
+3.15
3.31%
1 janv. 1980
95.836
-2.434
-2.48%
1 janv. 1981
95.77
-0.066
-0.07%
1 janv. 1982
94.706
-1.064
-1.11%
1 janv. 1983
96.778
+2.072
2.19%
1 janv. 1984
99.709
+2.931
3.03%
1 janv. 1985
107.821
+8.112
8.14%
1 janv. 1987
102.493
-5.328
-4.94%
1 janv. 1999
69.063
-33.43
-32.62%
1 janv. 2000
66.35
-2.713
-3.93%
1 janv. 2001
62.336
-4.013
-6.05%
1 janv. 2003
62.154
-0.183
-0.29%
1 janv. 2005
73.012
+10.858
17.47%
1 janv. 2006
91.499
+18.488
25.32%
1 janv. 2007
86.176
-5.324
-5.82%
1 janv. 2008
90.872
+4.696
5.45%
1 janv. 2009
95.308
+4.436
4.88%
1 janv. 2010
89.364
-5.944
-6.24%
1 janv. 2011
93.165
+3.801
4.25%
1 janv. 2013
88.419
-4.746
-5.09%
1 janv. 2014
82.091
-6.328
-7.16%
Classement des pays selon les statistiques actuelles par années


Commentaires: