29
/fr/
fr
AIzaSyAYiBZKx7MnpbEhh9jyipgxe19OcubqV5w
April 1, 2024
161890
Italy
ITA
true
2
1
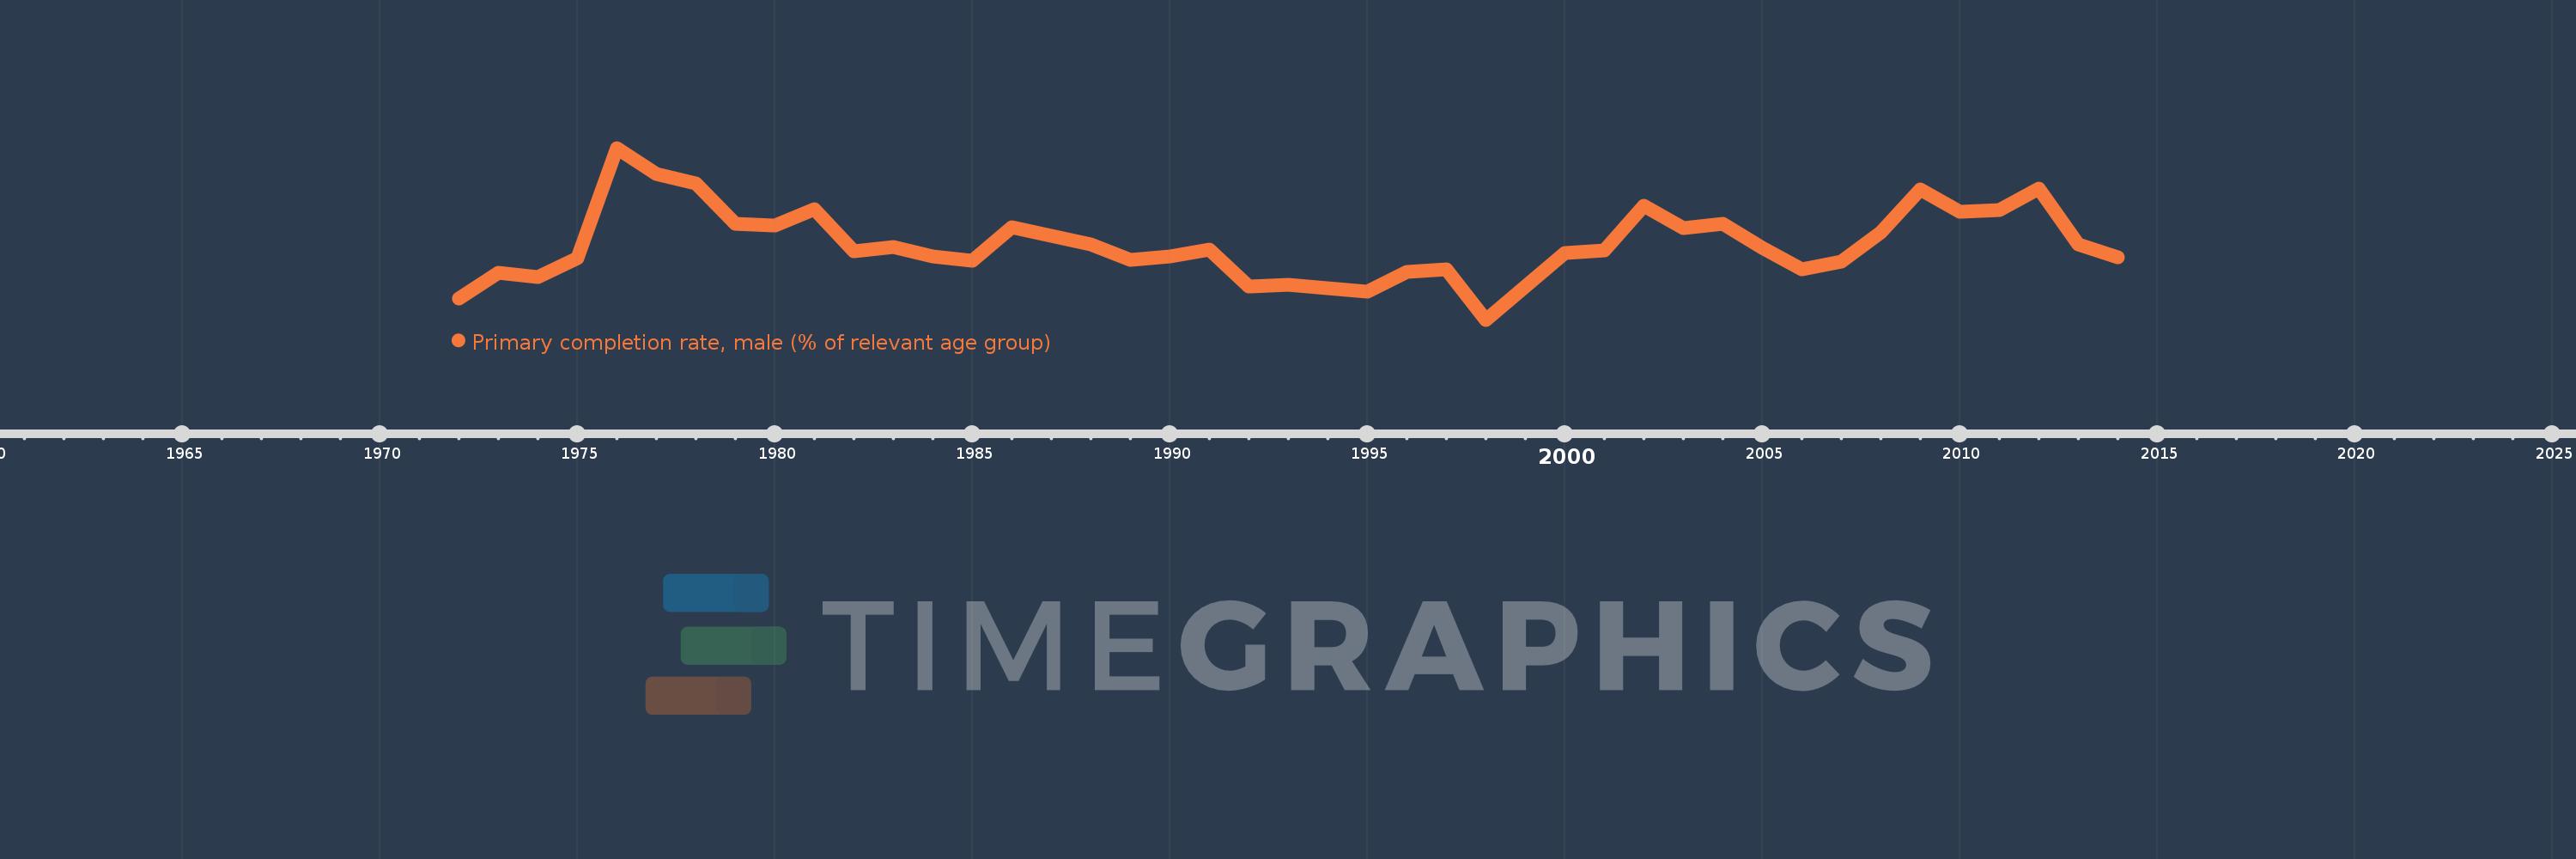
Primary completion rate, male (% of relevant age group)
2014,2013,2012,2011,2010,2009,2008,2007,2006,2005,2004,2003,2002,2001,2000,1998,1997,1996,1995,1993,1992,1991,1990,1989,1988,1987,1986,1985,1984,1983,1982,1981,1980,1979,1978,1977,1976,1975,1974,1973,1972
Cette statistique dans les autres pays:
AfghanistanAlbaniaAlgeriaAngolaAntigua and BarbudaArab WorldArgentinaArmeniaArubaAustriaAzerbaijanBahamas, TheBahrainBangladeshBarbadosBelarusBelgiumBelizeBeninBermudaBhutanBoliviaBosnia and HerzegovinaBotswanaBrunei DarussalamBulgariaBurkina FasoBurundiCabo VerdeCambodiaCameroonCanadaCaribbean small statesCentral African RepublicCentral Europe and the BalticsChadChileChinaColombiaComorosCongo, Dem. Rep.Congo, Rep.Costa RicaCote d'IvoireCroatiaCubaCyprusCzech RepublicDenmarkDjiboutiDominicaDominican RepublicEarly-demographic dividendEast Asia & PacificEast Asia & Pacific (excluding high income)East Asia & Pacific (IDA & IBRD countries)EcuadorEgypt, Arab Rep.El SalvadorEquatorial GuineaEritreaEstoniaEthiopiaEuro areaEurope & Central AsiaEurope & Central Asia (excluding high income)Europe & Central Asia (IDA & IBRD countries)European UnionFijiFinlandFragile and conflict affected situationsFranceGabonGambia, TheGeorgiaGermanyGhanaGreeceGrenadaGuatemalaGuineaGuinea-BissauGuyanaHaitiHeavily indebted poor countries (HIPC)High incomeHondurasHong Kong SAR, ChinaHungaryIBRD onlyIcelandIDA & IBRD totalIDA blendIDA onlyIDA totalIndiaIndonesiaIran, Islamic Rep.IraqIrelandIsraelItalyJamaicaJapanJordanKazakhstanKenyaKiribatiKorea, Dem. People’s Rep.Korea, Rep.KuwaitKyrgyz RepublicLao PDRLate-demographic dividendLatin America & Caribbean Latin America & Caribbean (excluding high income)Latin America & the Caribbean (IDA & IBRD countries)LatviaLeast developed countries: UN classificationLebanonLesothoLiberiaLibyaLiechtensteinLithuaniaLow & middle incomeLow incomeLower middle incomeLuxembourgMacao SAR, ChinaMacedonia, FYRMadagascarMalawiMaldivesMaliMaltaMarshall IslandsMauritaniaMauritiusMexicoMiddle East & North AfricaMiddle East & North Africa (excluding high income)Middle East & North Africa (IDA & IBRD countries)Middle incomeMoldovaMongoliaMontenegroMoroccoMozambiqueMyanmarNamibiaNauruNepalNetherlandsNew ZealandNicaraguaNigerNigeriaNorwayOECD membersOmanOther small statesPacific island small statesPakistanPalauPanamaPapua New GuineaParaguayPeruPhilippinesPolandPortugalPost-demographic dividendPre-demographic dividendQatarRomaniaRussian FederationRwandaSamoaSan MarinoSao Tome and PrincipeSaudi ArabiaSenegalSerbiaSeychellesSierra LeoneSlovak RepublicSloveniaSmall statesSolomon IslandsSouth AfricaSouth AsiaSouth Asia (IDA & IBRD)South SudanSpainSri LankaSt. Kitts and NevisSt. LuciaSt. Vincent and the GrenadinesSub-Saharan Africa Sub-Saharan Africa (excluding high income)Sub-Saharan Africa (IDA & IBRD countries)SudanSurinameSwazilandSwedenSwitzerlandSyrian Arab RepublicTajikistanTanzaniaThailandTimor-LesteTogoTongaTrinidad and TobagoTunisiaTurkeyTuvaluUgandaUkraineUnited Arab EmiratesUpper middle incomeUruguayUzbekistanVanuatuVenezuela, RBVietnamWest Bank and GazaWorldYemen, Rep.ZambiaZimbabwe La ligne de temps
Cette échelle de temps montre un graphique de 1972 année à 2014 année Italy. Les données jusqu'à 1971 année ne sont pas présentés. Quantité d'observations actuelles selon dates: 41.
Source (désignation):
Les indicateurs du développement mondiale
Source (organisation):
United Nations Educational, Scientific, and Cultural Organization (UNESCO) Institute for Statistics.
Catégories:
Education, Gender
Dernière mise à jour
23 avr. 2017
Les indicateurs de changement de valeurs selon les années
Minimum:
95.866
1 janv. 1998
Maximum:
107.876
1 janv. 1976
Pour la date d''observation
Valeur
Changement absolu
Le changement par rapport à la valeur précédente
1 janv. 1972
97.349
+97.349
0.0%
1 janv. 1973
99.17
+1.821
1.87%
1 janv. 1974
98.854
-0.316
-0.32%
1 janv. 1975
100.187
+1.333
1.35%
1 janv. 1976
107.876
+7.689
7.67%
1 janv. 1977
106.035
-1.841
-1.71%
1 janv. 1978
105.388
-0.647
-0.61%
1 janv. 1979
102.544
-2.844
-2.7%
1 janv. 1980
102.43
-0.114
-0.11%
1 janv. 1981
103.624
+1.194
1.17%
1 janv. 1982
100.677
-2.947
-2.84%
1 janv. 1983
100.978
+0.3
0.3%
1 janv. 1984
100.309
-0.669
-0.66%
1 janv. 1985
100.007
-0.301
-0.3%
1 janv. 1986
102.346
+2.339
2.34%
1 janv. 1987
101.728
-0.619
-0.6%
1 janv. 1988
101.104
-0.624
-0.61%
1 janv. 1989
100.05
-1.054
-1.04%
1 janv. 1990
100.27
+0.22
0.22%
1 janv. 1991
100.757
+0.487
0.49%
1 janv. 1992
98.215
-2.543
-2.52%
1 janv. 1993
98.303
+0.088
0.09%
1 janv. 1995
97.819
-0.484
-0.49%
1 janv. 1996
99.222
+1.403
1.43%
1 janv. 1997
99.401
+0.179
0.18%
1 janv. 1998
95.866
-3.535
-3.56%
1 janv. 2000
100.51
+4.644
4.84%
1 janv. 2001
100.72
+0.21
0.21%
1 janv. 2002
103.863
+3.144
3.12%
1 janv. 2003
102.286
-1.577
-1.52%
1 janv. 2004
102.578
+0.292
0.29%
1 janv. 2005
100.904
-1.674
-1.63%
1 janv. 2006
99.405
-1.499
-1.49%
1 janv. 2007
99.932
+0.527
0.53%
1 janv. 2008
101.97
+2.039
2.04%
1 janv. 2009
104.973
+3.003
2.94%
1 janv. 2010
103.414
-1.56
-1.49%
1 janv. 2011
103.515
+0.101
0.1%
1 janv. 2012
105.025
+1.51
1.46%
1 janv. 2013
101.13
-3.895
-3.71%
1 janv. 2014
100.224
-0.906
-0.9%
Classement des pays selon les statistiques actuelles par années


Commentaires: