29
/fr/
fr
AIzaSyAYiBZKx7MnpbEhh9jyipgxe19OcubqV5w
April 1, 2024
286500
Zambia
ZMB
true
2
1
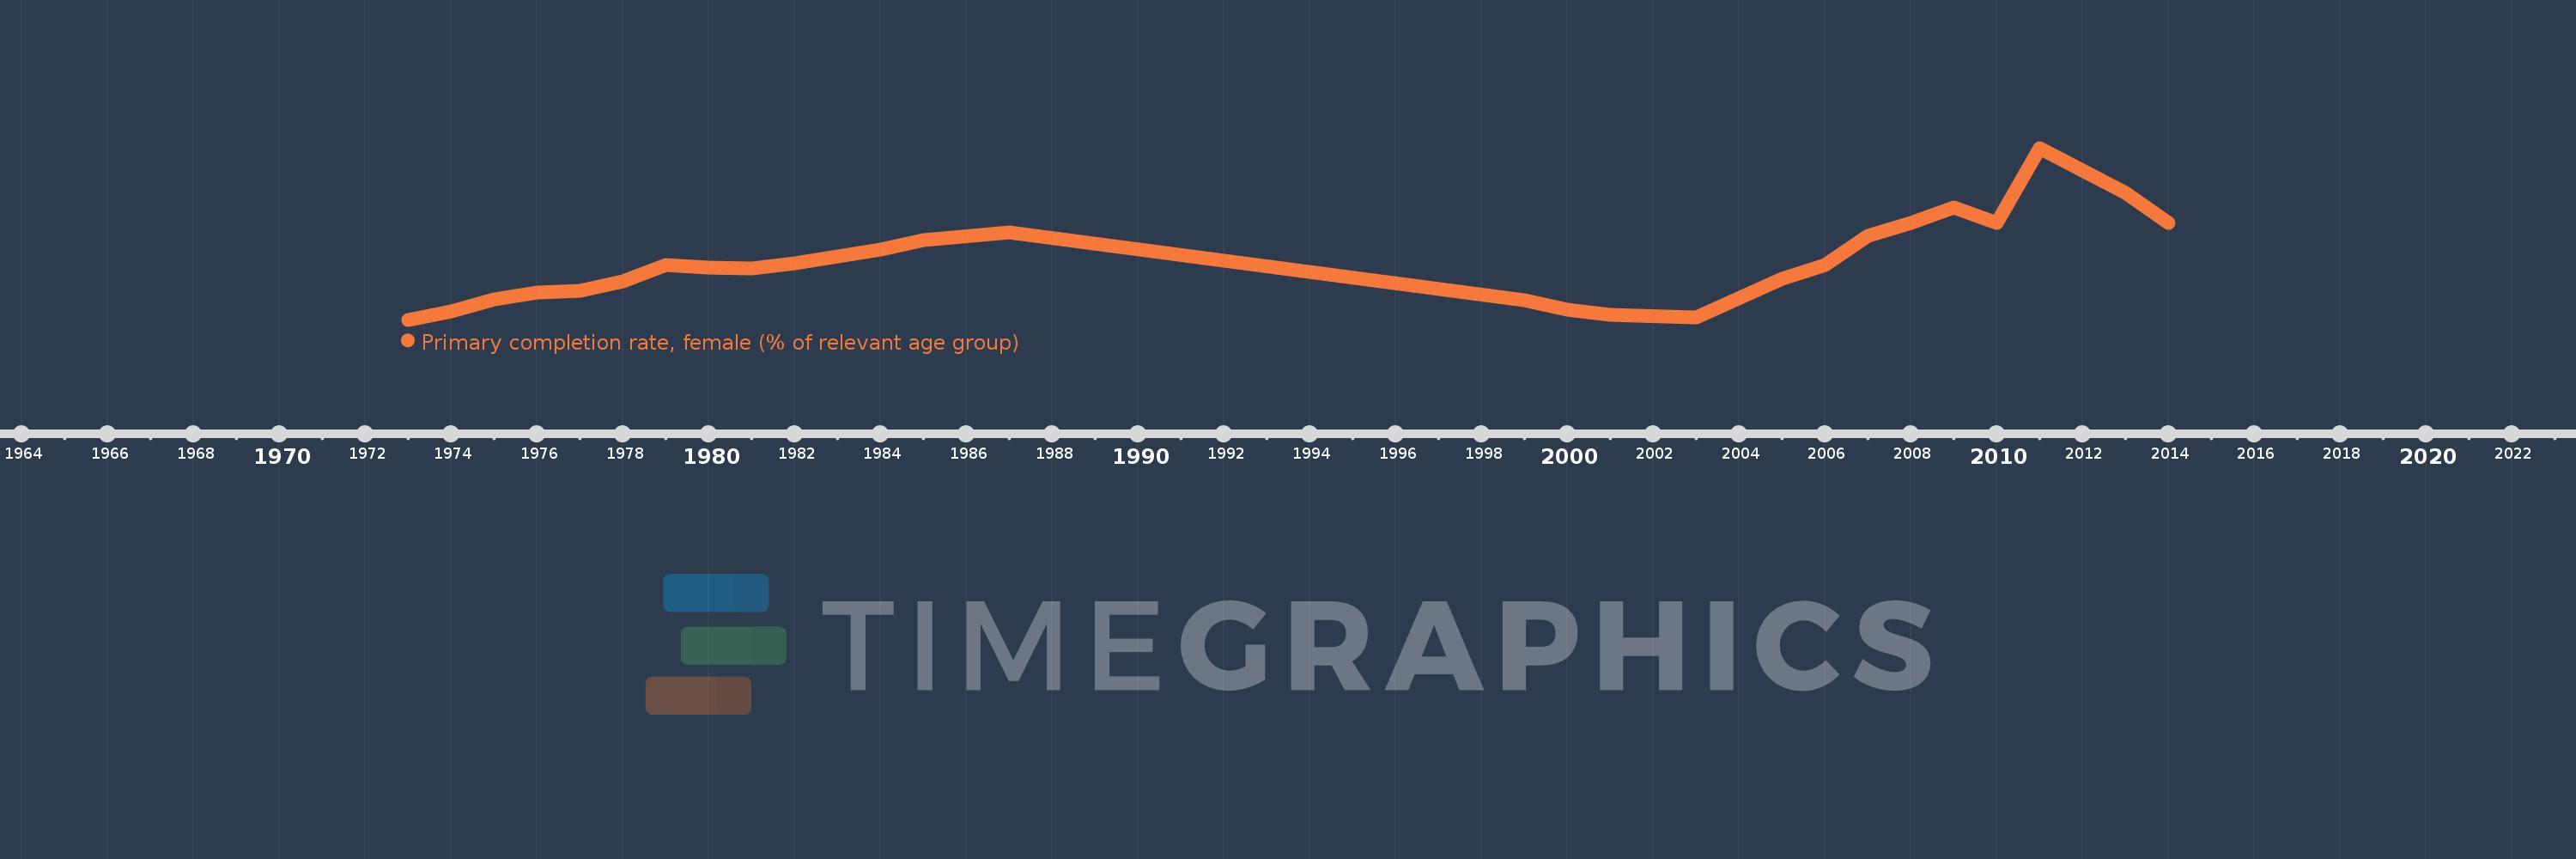
Primary completion rate, female (% of relevant age group)
2014,2013,2011,2010,2009,2008,2007,2006,2005,2003,2001,2000,1999,1987,1985,1984,1983,1982,1981,1980,1979,1978,1977,1976,1975,1974,1973
Cette statistique dans les autres pays:
AfghanistanAlbaniaAlgeriaAngolaAntigua and BarbudaArab WorldArgentinaArmeniaArubaAustriaAzerbaijanBahamas, TheBahrainBangladeshBarbadosBelarusBelgiumBelizeBeninBermudaBhutanBoliviaBosnia and HerzegovinaBotswanaBrunei DarussalamBulgariaBurkina FasoBurundiCabo VerdeCambodiaCameroonCanadaCaribbean small statesCentral African RepublicCentral Europe and the BalticsChadChileChinaColombiaComorosCongo, Dem. Rep.Congo, Rep.Costa RicaCote d'IvoireCroatiaCubaCyprusCzech RepublicDenmarkDjiboutiDominicaDominican RepublicEarly-demographic dividendEast Asia & PacificEast Asia & Pacific (excluding high income)East Asia & Pacific (IDA & IBRD countries)EcuadorEgypt, Arab Rep.El SalvadorEquatorial GuineaEritreaEstoniaEthiopiaEuro areaEurope & Central AsiaEurope & Central Asia (excluding high income)Europe & Central Asia (IDA & IBRD countries)European UnionFijiFinlandFragile and conflict affected situationsFranceGabonGambia, TheGeorgiaGermanyGhanaGreeceGrenadaGuatemalaGuineaGuinea-BissauGuyanaHaitiHeavily indebted poor countries (HIPC)High incomeHondurasHong Kong SAR, ChinaHungaryIBRD onlyIcelandIDA & IBRD totalIDA blendIDA onlyIDA totalIndiaIndonesiaIran, Islamic Rep.IraqIrelandIsraelItalyJamaicaJapanJordanKazakhstanKenyaKiribatiKorea, Dem. People’s Rep.Korea, Rep.KuwaitKyrgyz RepublicLao PDRLate-demographic dividendLatin America & Caribbean Latin America & Caribbean (excluding high income)Latin America & the Caribbean (IDA & IBRD countries)LatviaLeast developed countries: UN classificationLebanonLesothoLiberiaLibyaLiechtensteinLithuaniaLow & middle incomeLow incomeLower middle incomeLuxembourgMacao SAR, ChinaMacedonia, FYRMadagascarMalawiMaldivesMaliMaltaMarshall IslandsMauritaniaMauritiusMexicoMiddle East & North AfricaMiddle East & North Africa (excluding high income)Middle East & North Africa (IDA & IBRD countries)Middle incomeMoldovaMongoliaMontenegroMoroccoMozambiqueMyanmarNamibiaNauruNepalNetherlandsNew ZealandNicaraguaNigerNigeriaNorwayOECD membersOmanOther small statesPacific island small statesPakistanPalauPanamaPapua New GuineaParaguayPeruPhilippinesPolandPortugalPost-demographic dividendPre-demographic dividendQatarRomaniaRussian FederationRwandaSamoaSan MarinoSao Tome and PrincipeSaudi ArabiaSenegalSerbiaSeychellesSierra LeoneSlovak RepublicSloveniaSmall statesSolomon IslandsSouth AfricaSouth AsiaSouth Asia (IDA & IBRD)South SudanSpainSri LankaSt. Kitts and NevisSt. LuciaSt. Vincent and the GrenadinesSub-Saharan Africa Sub-Saharan Africa (excluding high income)Sub-Saharan Africa (IDA & IBRD countries)SudanSurinameSwazilandSwedenSwitzerlandSyrian Arab RepublicTajikistanTanzaniaThailandTimor-LesteTogoTongaTrinidad and TobagoTunisiaTurkeyTuvaluUgandaUkraineUnited Arab EmiratesUpper middle incomeUruguayUzbekistanVanuatuVenezuela, RBVietnamWest Bank and GazaWorldYemen, Rep.ZambiaZimbabwe La ligne de temps
Cette échelle de temps montre un graphique de 1973 année à 2014 année Zambia. Les données jusqu'à 1972 année ne sont pas présentés. Quantité d'observations actuelles selon dates: 27.
Source (désignation):
Les indicateurs du développement mondiale
Source (organisation):
United Nations Educational, Scientific, and Cultural Organization (UNESCO) Institute for Statistics.
Catégories:
Education, Gender
Dernière mise à jour
23 avr. 2017
Les indicateurs de changement de valeurs selon les années
Minimum:
50.947
1 janv. 1973
Maximum:
102.472
1 janv. 2011
Pour la date d''observation
Valeur
Changement absolu
Le changement par rapport à la valeur précédente
1 janv. 1973
50.947
+50.947
0.0%
1 janv. 1974
53.563
+2.616
5.14%
1 janv. 1975
57.179
+3.616
6.75%
1 janv. 1976
59.185
+2.006
3.51%
1 janv. 1977
59.734
+0.549
0.93%
1 janv. 1978
62.48
+2.746
4.6%
1 janv. 1979
67.346
+4.866
7.79%
1 janv. 1980
66.498
-0.848
-1.26%
1 janv. 1981
66.22
-0.278
-0.42%
1 janv. 1982
67.953
+1.733
2.62%
1 janv. 1983
69.953
+1.999
2.94%
1 janv. 1984
71.916
+1.964
2.81%
1 janv. 1985
74.749
+2.833
3.94%
1 janv. 1987
77.18
+2.431
3.25%
1 janv. 1999
56.72
-20.459
-26.51%
1 janv. 2000
54.035
-2.685
-4.73%
1 janv. 2001
52.405
-1.63
-3.02%
1 janv. 2003
51.684
-0.721
-1.38%
1 janv. 2005
63.214
+11.531
22.31%
1 janv. 2006
67.235
+4.021
6.36%
1 janv. 2007
76.187
+8.952
13.31%
1 janv. 2008
80.08
+3.894
5.11%
1 janv. 2009
84.558
+4.478
5.59%
1 janv. 2010
79.894
-4.664
-5.52%
1 janv. 2011
102.472
+22.578
28.26%
1 janv. 2013
89.066
-13.406
-13.08%
1 janv. 2014
79.919
-9.147
-10.27%
Classement des pays selon les statistiques actuelles par années


Commentaires: