29
/fr/
fr
AIzaSyAYiBZKx7MnpbEhh9jyipgxe19OcubqV5w
April 1, 2024
191827
Malta
MLT
true
2
1
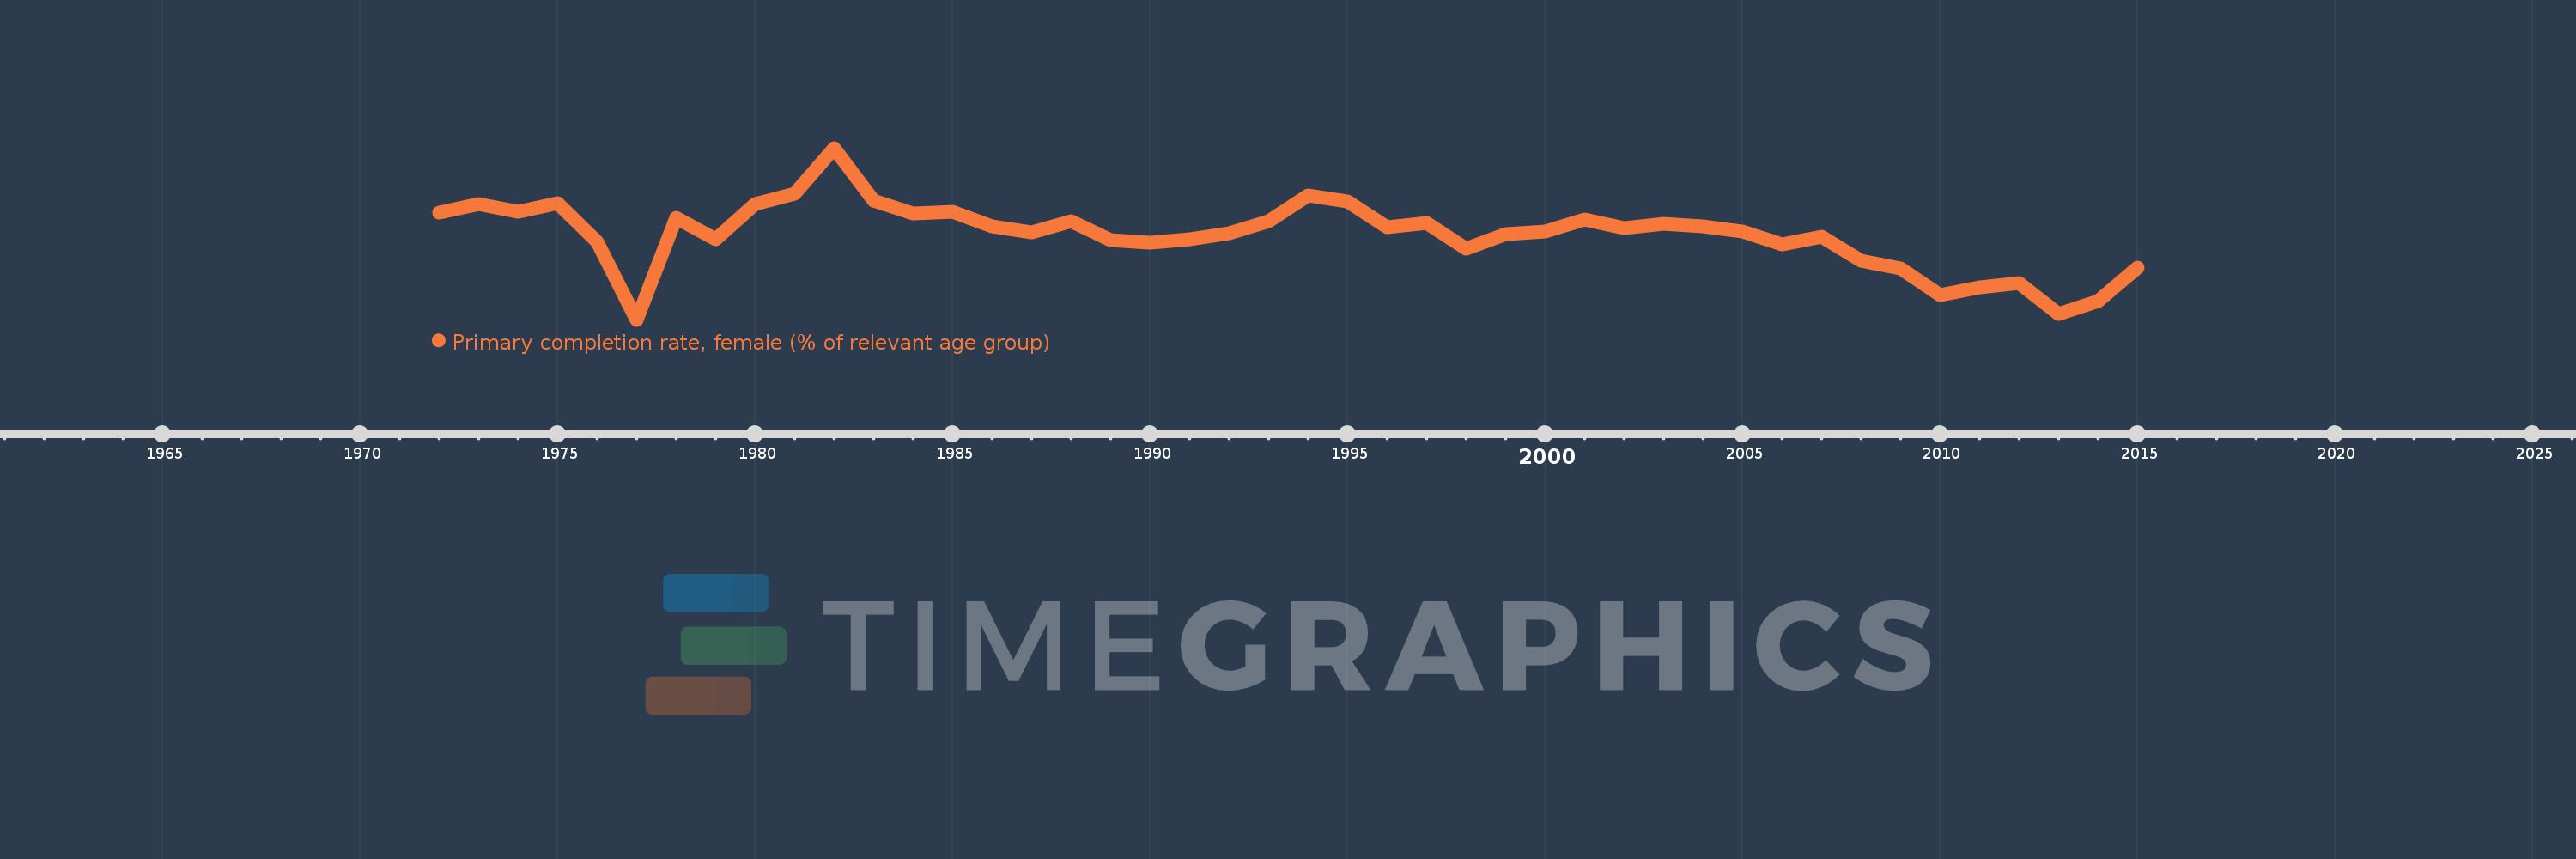
Primary completion rate, female (% of relevant age group)
2015,2014,2013,2012,2011,2010,2009,2008,2007,2006,2005,2004,2003,2002,2001,2000,1999,1998,1997,1996,1995,1994,1993,1992,1991,1990,1989,1988,1987,1986,1985,1984,1983,1982,1981,1980,1979,1978,1977,1976,1975,1974,1973,1972
Cette statistique dans les autres pays:
AfghanistanAlbaniaAlgeriaAngolaAntigua and BarbudaArab WorldArgentinaArmeniaArubaAustriaAzerbaijanBahamas, TheBahrainBangladeshBarbadosBelarusBelgiumBelizeBeninBermudaBhutanBoliviaBosnia and HerzegovinaBotswanaBrunei DarussalamBulgariaBurkina FasoBurundiCabo VerdeCambodiaCameroonCanadaCaribbean small statesCentral African RepublicCentral Europe and the BalticsChadChileChinaColombiaComorosCongo, Dem. Rep.Congo, Rep.Costa RicaCote d'IvoireCroatiaCubaCyprusCzech RepublicDenmarkDjiboutiDominicaDominican RepublicEarly-demographic dividendEast Asia & PacificEast Asia & Pacific (excluding high income)East Asia & Pacific (IDA & IBRD countries)EcuadorEgypt, Arab Rep.El SalvadorEquatorial GuineaEritreaEstoniaEthiopiaEuro areaEurope & Central AsiaEurope & Central Asia (excluding high income)Europe & Central Asia (IDA & IBRD countries)European UnionFijiFinlandFragile and conflict affected situationsFranceGabonGambia, TheGeorgiaGermanyGhanaGreeceGrenadaGuatemalaGuineaGuinea-BissauGuyanaHaitiHeavily indebted poor countries (HIPC)High incomeHondurasHong Kong SAR, ChinaHungaryIBRD onlyIcelandIDA & IBRD totalIDA blendIDA onlyIDA totalIndiaIndonesiaIran, Islamic Rep.IraqIrelandIsraelItalyJamaicaJapanJordanKazakhstanKenyaKiribatiKorea, Dem. People’s Rep.Korea, Rep.KuwaitKyrgyz RepublicLao PDRLate-demographic dividendLatin America & Caribbean Latin America & Caribbean (excluding high income)Latin America & the Caribbean (IDA & IBRD countries)LatviaLeast developed countries: UN classificationLebanonLesothoLiberiaLibyaLiechtensteinLithuaniaLow & middle incomeLow incomeLower middle incomeLuxembourgMacao SAR, ChinaMacedonia, FYRMadagascarMalawiMaldivesMaliMaltaMarshall IslandsMauritaniaMauritiusMexicoMiddle East & North AfricaMiddle East & North Africa (excluding high income)Middle East & North Africa (IDA & IBRD countries)Middle incomeMoldovaMongoliaMontenegroMoroccoMozambiqueMyanmarNamibiaNauruNepalNetherlandsNew ZealandNicaraguaNigerNigeriaNorwayOECD membersOmanOther small statesPacific island small statesPakistanPalauPanamaPapua New GuineaParaguayPeruPhilippinesPolandPortugalPost-demographic dividendPre-demographic dividendQatarRomaniaRussian FederationRwandaSamoaSan MarinoSao Tome and PrincipeSaudi ArabiaSenegalSerbiaSeychellesSierra LeoneSlovak RepublicSloveniaSmall statesSolomon IslandsSouth AfricaSouth AsiaSouth Asia (IDA & IBRD)South SudanSpainSri LankaSt. Kitts and NevisSt. LuciaSt. Vincent and the GrenadinesSub-Saharan Africa Sub-Saharan Africa (excluding high income)Sub-Saharan Africa (IDA & IBRD countries)SudanSurinameSwazilandSwedenSwitzerlandSyrian Arab RepublicTajikistanTanzaniaThailandTimor-LesteTogoTongaTrinidad and TobagoTunisiaTurkeyTuvaluUgandaUkraineUnited Arab EmiratesUpper middle incomeUruguayUzbekistanVanuatuVenezuela, RBVietnamWest Bank and GazaWorldYemen, Rep.ZambiaZimbabwe La ligne de temps
Cette échelle de temps montre un graphique de 1972 année à 2015 année Malta. Les données jusqu'à 1971 année ne sont pas présentés. Quantité d'observations actuelles selon dates: 44.
Source (désignation):
Les indicateurs du développement mondiale
Source (organisation):
United Nations Educational, Scientific, and Cultural Organization (UNESCO) Institute for Statistics.
Catégories:
Education, Gender
Dernière mise à jour
23 avr. 2017
Les indicateurs de changement de valeurs selon les années
Minimum:
73.902
1 janv. 1977
Maximum:
126.085
1 janv. 1982
Pour la date d''observation
Valeur
Changement absolu
Le changement par rapport à la valeur précédente
1 janv. 1972
106.438
+106.438
0.0%
1 janv. 1973
109.122
+2.684
2.52%
1 janv. 1974
106.705
-2.417
-2.21%
1 janv. 1975
109.181
+2.476
2.32%
1 janv. 1976
97.453
-11.728
-10.74%
1 janv. 1977
73.902
-23.551
-24.17%
1 janv. 1978
104.745
+30.843
41.74%
1 janv. 1979
98.252
-6.493
-6.2%
1 janv. 1980
109.053
+10.801
10.99%
1 janv. 1981
112.135
+3.083
2.83%
1 janv. 1982
126.085
+13.95
12.44%
1 janv. 1983
110.096
-15.989
-12.68%
1 janv. 1984
106.295
-3.801
-3.45%
1 janv. 1985
106.637
+0.342
0.32%
1 janv. 1986
102.393
-4.244
-3.98%
1 janv. 1987
100.417
-1.976
-1.93%
1 janv. 1988
103.955
+3.538
3.52%
1 janv. 1989
98.157
-5.797
-5.58%
1 janv. 1990
97.299
-0.858
-0.87%
1 janv. 1991
98.373
+1.073
1.1%
1 janv. 1992
100.284
+1.911
1.94%
1 janv. 1993
103.878
+3.594
3.58%
1 janv. 1994
111.567
+7.689
7.4%
1 janv. 1995
109.719
-1.848
-1.66%
1 janv. 1996
101.908
-7.811
-7.12%
1 janv. 1997
103.289
+1.382
1.36%
1 janv. 1998
95.466
-7.823
-7.57%
1 janv. 1999
99.858
+4.392
4.6%
1 janv. 2000
100.739
+0.881
0.88%
1 janv. 2001
104.234
+3.495
3.47%
1 janv. 2002
101.612
-2.622
-2.52%
1 janv. 2003
103.165
+1.553
1.53%
1 janv. 2004
102.382
-0.783
-0.76%
1 janv. 2005
100.736
-1.646
-1.61%
1 janv. 2006
96.768
-3.968
-3.94%
1 janv. 2007
99.006
+2.238
2.31%
1 janv. 2008
91.9
-7.106
-7.18%
1 janv. 2009
89.423
-2.477
-2.7%
1 janv. 2010
81.494
-7.929
-8.87%
1 janv. 2011
83.821
+2.327
2.86%
1 janv. 2012
84.979
+1.157
1.38%
1 janv. 2013
75.667
-9.312
-10.96%
1 janv. 2014
79.511
+3.844
5.08%
1 janv. 2015
89.868
+10.357
13.03%
Classement des pays selon les statistiques actuelles par années


Commentaires: