29
/fr/
fr
AIzaSyAYiBZKx7MnpbEhh9jyipgxe19OcubqV5w
April 1, 2024
283654
West Bank and Gaza
PSE
true
2
1
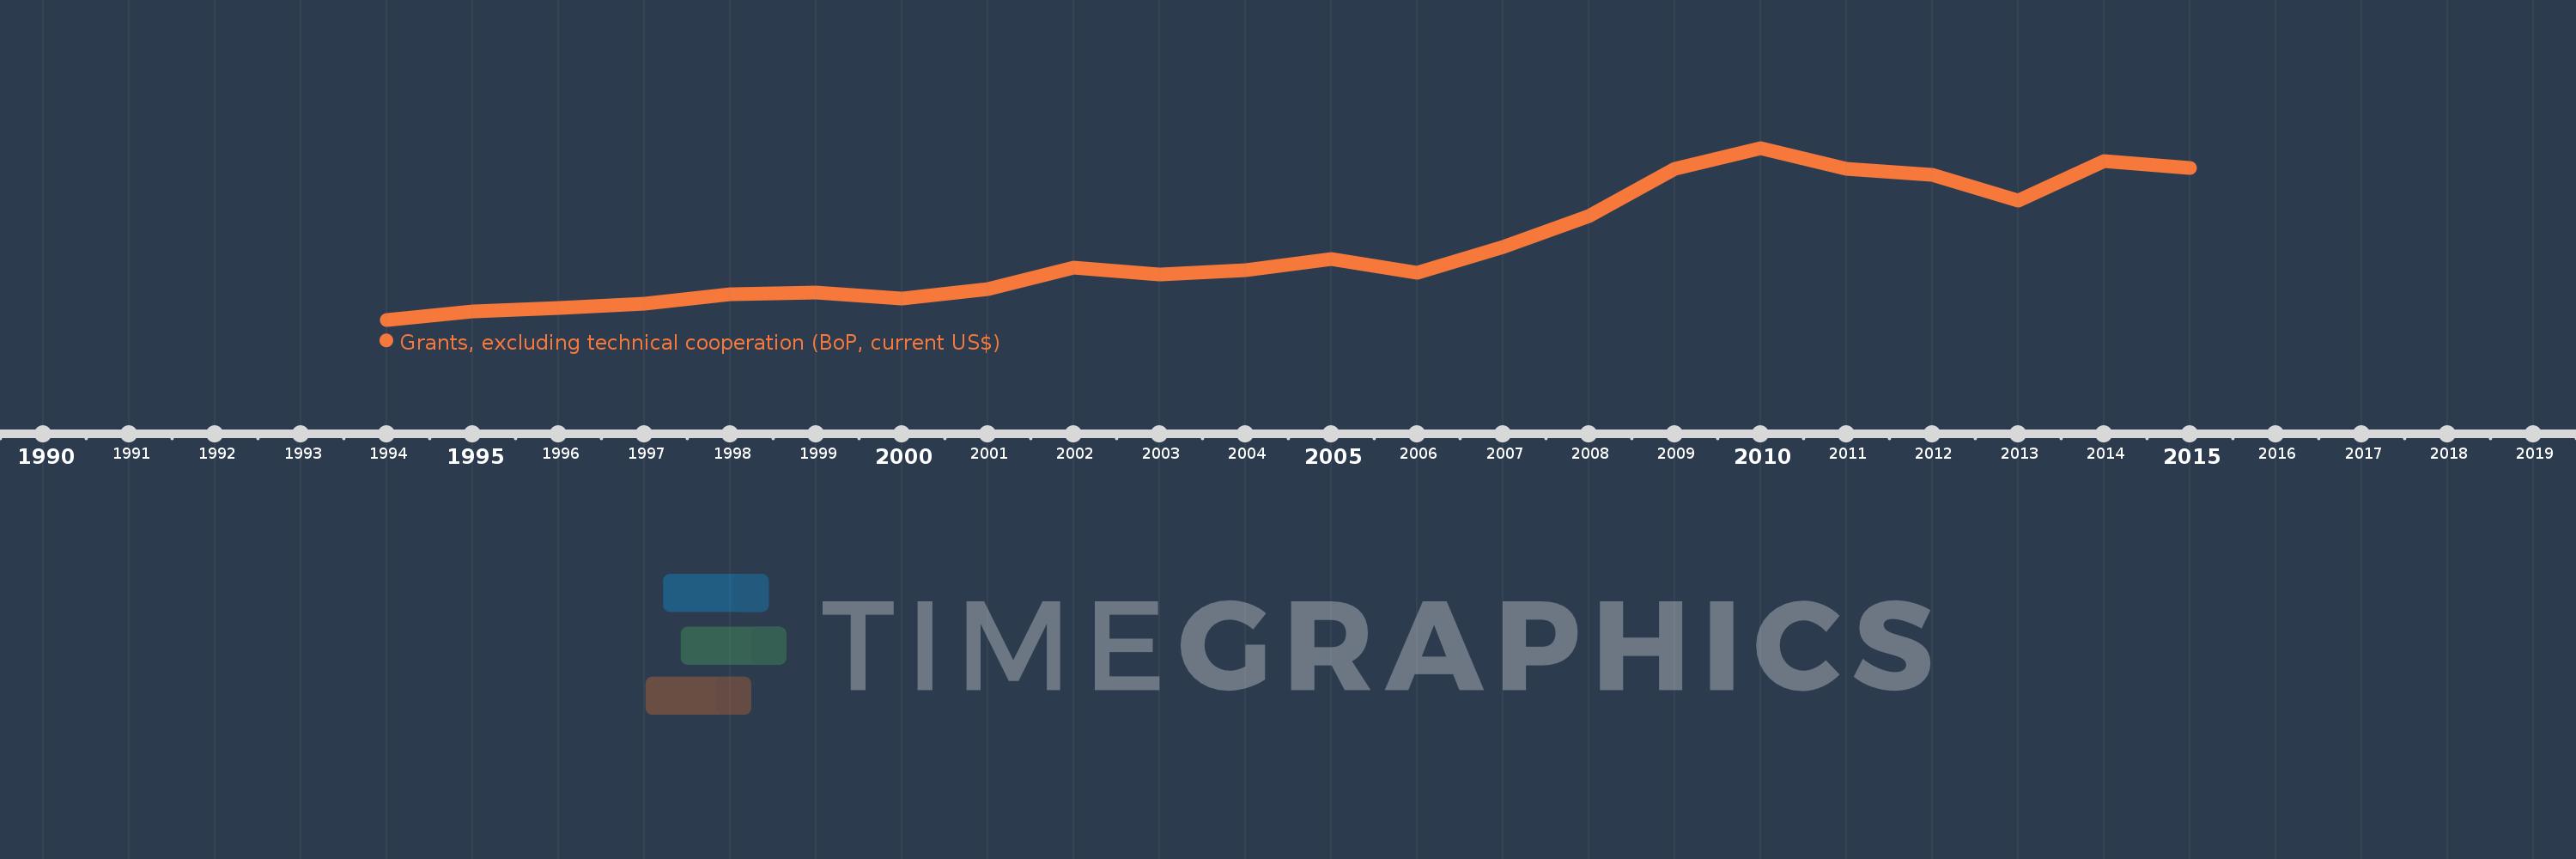
Grants, excluding technical cooperation (BoP, current US$)
2015,2014,2013,2012,2011,2010,2009,2008,2007,2006,2005,2004,2003,2002,2001,2000,1999,1998,1997,1996,1995,1994
Cette statistique dans les autres pays:
AfghanistanAlbaniaAlgeriaAngolaAntigua and BarbudaArgentinaArmeniaArubaAzerbaijanBahamas, TheBahrainBangladeshBarbadosBelarusBelizeBeninBermudaBhutanBoliviaBosnia and HerzegovinaBotswanaBrazilBrunei DarussalamBurkina FasoBurundiCabo VerdeCambodiaCameroonCayman IslandsCentral African RepublicChadChileChinaColombiaComorosCongo, Dem. Rep.Congo, Rep.Costa RicaCote d'IvoireCroatiaCubaCyprusDjiboutiDominicaDominican RepublicEcuadorEgypt, Arab Rep.El SalvadorEquatorial GuineaEritreaEthiopiaFijiFrench PolynesiaGabonGambia, TheGeorgiaGhanaGibraltarGrenadaGuatemalaGuineaGuinea-BissauGuyanaHaitiHondurasHong Kong SAR, ChinaIndiaIndonesiaIran, Islamic Rep.IraqIsraelJamaicaJordanKazakhstanKenyaKiribatiKorea, Dem. People’s Rep.Korea, Rep.KosovoKuwaitKyrgyz RepublicLao PDRLebanonLesothoLiberiaLibyaLow & middle incomeMacedonia, FYRMadagascarMalawiMalaysiaMaldivesMaliMaltaMarshall IslandsMauritaniaMauritiusMexicoMicronesia, Fed. Sts.MoldovaMongoliaMontenegroMoroccoMozambiqueMyanmarNamibiaNepalNew CaledoniaNicaraguaNigerNigeriaOmanPakistanPalauPanamaPapua New GuineaParaguayPeruPhilippinesQatarRwandaSamoaSao Tome and PrincipeSaudi ArabiaSenegalSerbiaSeychellesSierra LeoneSingaporeSloveniaSolomon IslandsSomaliaSouth AfricaSouth SudanSri LankaSt. Kitts and NevisSt. LuciaSt. Vincent and the GrenadinesSudanSurinameSwazilandSyrian Arab RepublicTajikistanTanzaniaThailandTimor-LesteTogoTongaTrinidad and TobagoTunisiaTurkeyTurkmenistanTurks and Caicos IslandsTuvaluUgandaUkraineUnited Arab EmiratesUruguayUzbekistanVanuatuVenezuela, RBVietnamWest Bank and GazaYemen, Rep.ZambiaZimbabwe La ligne de temps
Cette échelle de temps montre un graphique de 1994 année à 2015 année West Bank and Gaza. Les données jusqu'à 1993 année ne sont pas présentés. Quantité d'observations actuelles selon dates: 22.
Source (désignation):
Les indicateurs du développement mondiale
Source (organisation):
World Bank, International Debt Statistics, and OECD.
Catégories:
Economy & Growth, External Debt, Aid Effectiveness
Dernière mise à jour
23 avr. 2017
Les indicateurs de changement de valeurs selon les années
Minimum:
77.29 mln.
1 janv. 1994
Maximum:
2.651 mds
1 janv. 2010
Pour la date d''observation
Valeur
Changement absolu
Le changement par rapport à la valeur précédente
1 janv. 1994
77.29 mln.
+77.29 mln.
0.0%
1 janv. 1995
197.91 mln.
+120.62 mln.
156.06%
1 janv. 1996
250.19 mln.
+52.28 mln.
26.42%
1 janv. 1997
322.16 mln.
+71.97 mln.
28.77%
1 janv. 1998
465.23 mln.
+143.07 mln.
44.41%
1 janv. 1999
480.68 mln.
+15.45 mln.
3.32%
1 janv. 2000
400.53 mln.
-80.15 mln.
-16.67%
1 janv. 2001
538.58 mln.
+138.05 mln.
34.47%
1 janv. 2002
856.23 mln.
+317.65 mln.
58.98%
1 janv. 2003
751.83 mln.
-104.4 mln.
-12.19%
1 janv. 2004
822.31 mln.
+70.48 mln.
9.37%
1 janv. 2005
992.42 mln.
+170.11 mln.
20.69%
1 janv. 2006
784.72 mln.
-207.7 mln.
-20.93%
1 janv. 2007
1.162 mds
+377.1 mln.
48.06%
1 janv. 2008
1.635 mds
+472.99 mln.
40.71%
1 janv. 2009
2.337 mds
+701.72 mln.
42.92%
1 janv. 2010
2.651 mds
+314.46 mln.
13.46%
1 janv. 2011
2.341 mds
-309.51 mln.
-11.68%
1 janv. 2012
2.246 mds
-95.14 mln.
-4.06%
1 janv. 2013
1.856 mds
-390.25 mln.
-17.37%
1 janv. 2014
2.457 mds
+600.7 mln.
32.36%
1 janv. 2015
2.355 mds
-101.9 mln.
-4.15%
Classement des pays selon les statistiques actuelles par années


Commentaires: