29
/fr/
fr
AIzaSyAYiBZKx7MnpbEhh9jyipgxe19OcubqV5w
April 1, 2024
147983
Guyana
GUY
true
2
1
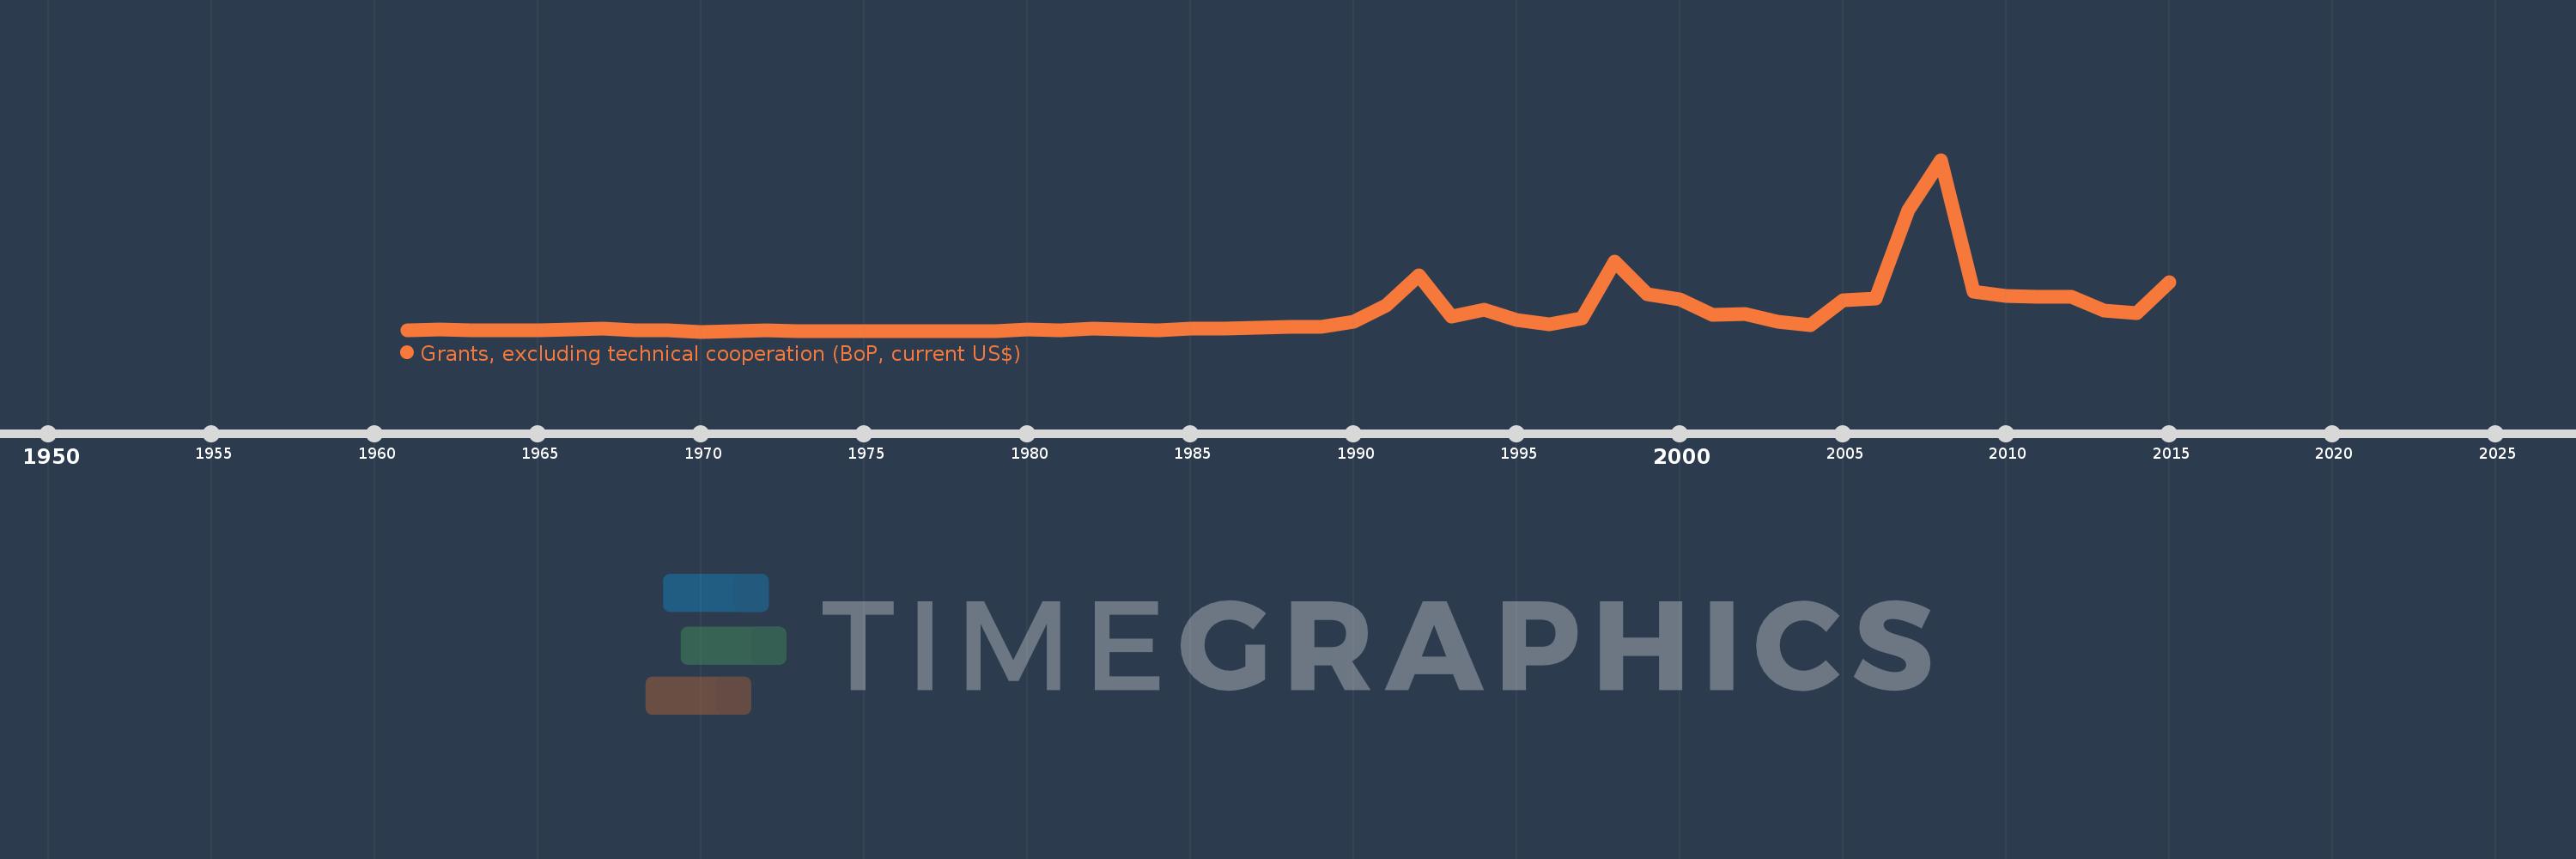
Grants, excluding technical cooperation (BoP, current US$)
2015,2014,2013,2012,2011,2010,2009,2008,2007,2006,2005,2004,2003,2002,2001,2000,1999,1998,1997,1996,1995,1994,1993,1992,1991,1990,1989,1988,1987,1986,1985,1984,1983,1982,1981,1980,1979,1978,1977,1976,1975,1974,1973,1972,1971,1970,1969,1968,1967,1966,1965,1964,1963,1962,1961
Cette statistique dans les autres pays:
AfghanistanAlbaniaAlgeriaAngolaAntigua and BarbudaArgentinaArmeniaArubaAzerbaijanBahamas, TheBahrainBangladeshBarbadosBelarusBelizeBeninBermudaBhutanBoliviaBosnia and HerzegovinaBotswanaBrazilBrunei DarussalamBurkina FasoBurundiCabo VerdeCambodiaCameroonCayman IslandsCentral African RepublicChadChileChinaColombiaComorosCongo, Dem. Rep.Congo, Rep.Costa RicaCote d'IvoireCroatiaCubaCyprusDjiboutiDominicaDominican RepublicEcuadorEgypt, Arab Rep.El SalvadorEquatorial GuineaEritreaEthiopiaFijiFrench PolynesiaGabonGambia, TheGeorgiaGhanaGibraltarGrenadaGuatemalaGuineaGuinea-BissauGuyanaHaitiHondurasHong Kong SAR, ChinaIndiaIndonesiaIran, Islamic Rep.IraqIsraelJamaicaJordanKazakhstanKenyaKiribatiKorea, Dem. People’s Rep.Korea, Rep.KosovoKuwaitKyrgyz RepublicLao PDRLebanonLesothoLiberiaLibyaLow & middle incomeMacedonia, FYRMadagascarMalawiMalaysiaMaldivesMaliMaltaMarshall IslandsMauritaniaMauritiusMexicoMicronesia, Fed. Sts.MoldovaMongoliaMontenegroMoroccoMozambiqueMyanmarNamibiaNepalNew CaledoniaNicaraguaNigerNigeriaOmanPakistanPalauPanamaPapua New GuineaParaguayPeruPhilippinesQatarRwandaSamoaSao Tome and PrincipeSaudi ArabiaSenegalSerbiaSeychellesSierra LeoneSingaporeSloveniaSolomon IslandsSomaliaSouth AfricaSouth SudanSri LankaSt. Kitts and NevisSt. LuciaSt. Vincent and the GrenadinesSudanSurinameSwazilandSyrian Arab RepublicTajikistanTanzaniaThailandTimor-LesteTogoTongaTrinidad and TobagoTunisiaTurkeyTurkmenistanTurks and Caicos IslandsTuvaluUgandaUkraineUnited Arab EmiratesUruguayUzbekistanVanuatuVenezuela, RBVietnamWest Bank and GazaYemen, Rep.ZambiaZimbabwe La ligne de temps
Cette échelle de temps montre un graphique de 1961 année à 2015 année Guyana. Les données jusqu'à 1960 année ne sont pas présentés. Quantité d'observations actuelles selon dates: 55.
Source (désignation):
Les indicateurs du développement mondiale
Source (organisation):
World Bank, International Debt Statistics, and OECD.
Catégories:
Economy & Growth, External Debt, Aid Effectiveness
Dernière mise à jour
23 avr. 2017
Les indicateurs de changement de valeurs selon les années
Minimum:
-230.0 milles
1 janv. 1970
Maximum:
481.19 mln.
1 janv. 2008
Pour la date d''observation
Valeur
Changement absolu
Le changement par rapport à la valeur précédente
1 janv. 1961
3.2 mln.
+3.2 mln.
0.0%
1 janv. 1962
4.8 mln.
+1.6 mln.
50.0%
1 janv. 1963
3.73 mln.
-1.07 mln.
-22.29%
1 janv. 1964
2.58 mln.
-1.15 mln.
-30.83%
1 janv. 1965
3.08 mln.
+500.0 milles
19.38%
1 janv. 1966
4.92 mln.
+1.84 mln.
59.74%
1 janv. 1967
7.07 mln.
+2.15 mln.
43.7%
1 janv. 1968
4.51 mln.
-2.56 mln.
-36.21%
1 janv. 1969
4.21 mln.
-300.0 milles
-6.65%
1 janv. 1970
-230.0 milles
-4.44 mln.
-105.46%
1 janv. 1971
1.81 mln.
+2.04 mln.
-886.96%
1 janv. 1972
2.65 mln.
+840.0 milles
46.41%
1 janv. 1973
2.06 mln.
-590.0 milles
-22.26%
1 janv. 1974
750.0 milles
-1.31 mln.
-63.59%
1 janv. 1975
80.0 milles
-670.0 milles
-89.33%
1 janv. 1976
10.0 milles
-70.0 milles
-87.5%
1 janv. 1977
400.0 milles
+390.0 milles
3.9 milles%
1 janv. 1978
1.5 mln.
+1.1 mln.
275.0%
1 janv. 1979
1.78 mln.
+280.0 milles
18.67%
1 janv. 1980
6.62 mln.
+4.84 mln.
271.91%
1 janv. 1981
4.01 mln.
-2.61 mln.
-39.43%
1 janv. 1982
8.82 mln.
+4.81 mln.
119.95%
1 janv. 1983
5.87 mln.
-2.95 mln.
-33.45%
1 janv. 1984
3.74 mln.
-2.13 mln.
-36.29%
1 janv. 1985
7.25 mln.
+3.51 mln.
93.85%
1 janv. 1986
8.45 mln.
+1.2 mln.
16.55%
1 janv. 1987
11.49 mln.
+3.04 mln.
35.98%
1 janv. 1988
12.99 mln.
+1.5 mln.
13.05%
1 janv. 1989
13.78 mln.
+790.0 milles
6.08%
1 janv. 1990
26.43 mln.
+12.65 mln.
91.8%
1 janv. 1991
74.0 mln.
+47.57 mln.
179.98%
1 janv. 1992
157.75 mln.
+83.75 mln.
113.18%
1 janv. 1993
42.07 mln.
-115.68 mln.
-73.33%
1 janv. 1994
60.86 mln.
+18.79 mln.
44.66%
1 janv. 1995
32.45 mln.
-28.41 mln.
-46.68%
1 janv. 1996
21.06 mln.
-11.39 mln.
-35.1%
1 janv. 1997
36.56 mln.
+15.5 mln.
73.6%
1 janv. 1998
195.59 mln.
+159.03 mln.
434.98%
1 janv. 1999
104.71 mln.
-90.88 mln.
-46.46%
1 janv. 2000
89.69 mln.
-15.02 mln.
-14.34%
1 janv. 2001
47.33 mln.
-42.36 mln.
-47.23%
1 janv. 2002
49.66 mln.
+2.33 mln.
4.92%
1 janv. 2003
26.5 mln.
-23.16 mln.
-46.64%
1 janv. 2004
17.19 mln.
-9.31 mln.
-35.13%
1 janv. 2005
87.45 mln.
+70.26 mln.
408.73%
1 janv. 2006
91.69 mln.
+4.24 mln.
4.85%
1 janv. 2007
339.95 mln.
+248.26 mln.
270.76%
1 janv. 2008
481.19 mln.
+141.24 mln.
41.55%
1 janv. 2009
112.16 mln.
-369.03 mln.
-76.69%
1 janv. 2010
98.47 mln.
-13.69 mln.
-12.21%
1 janv. 2011
97.73 mln.
-740.0 milles
-0.75%
1 janv. 2012
97.56 mln.
-170.0 milles
-0.17%
1 janv. 2013
58.79 mln.
-38.77 mln.
-39.74%
1 janv. 2014
50.4 mln.
-8.39 mln.
-14.27%
1 janv. 2015
138.63 mln.
+88.23 mln.
175.06%
Classement des pays selon les statistiques actuelles par années


Commentaires: