29
/fr/
fr
AIzaSyAYiBZKx7MnpbEhh9jyipgxe19OcubqV5w
April 1, 2024
278038
Uruguay
URY
true
2
1
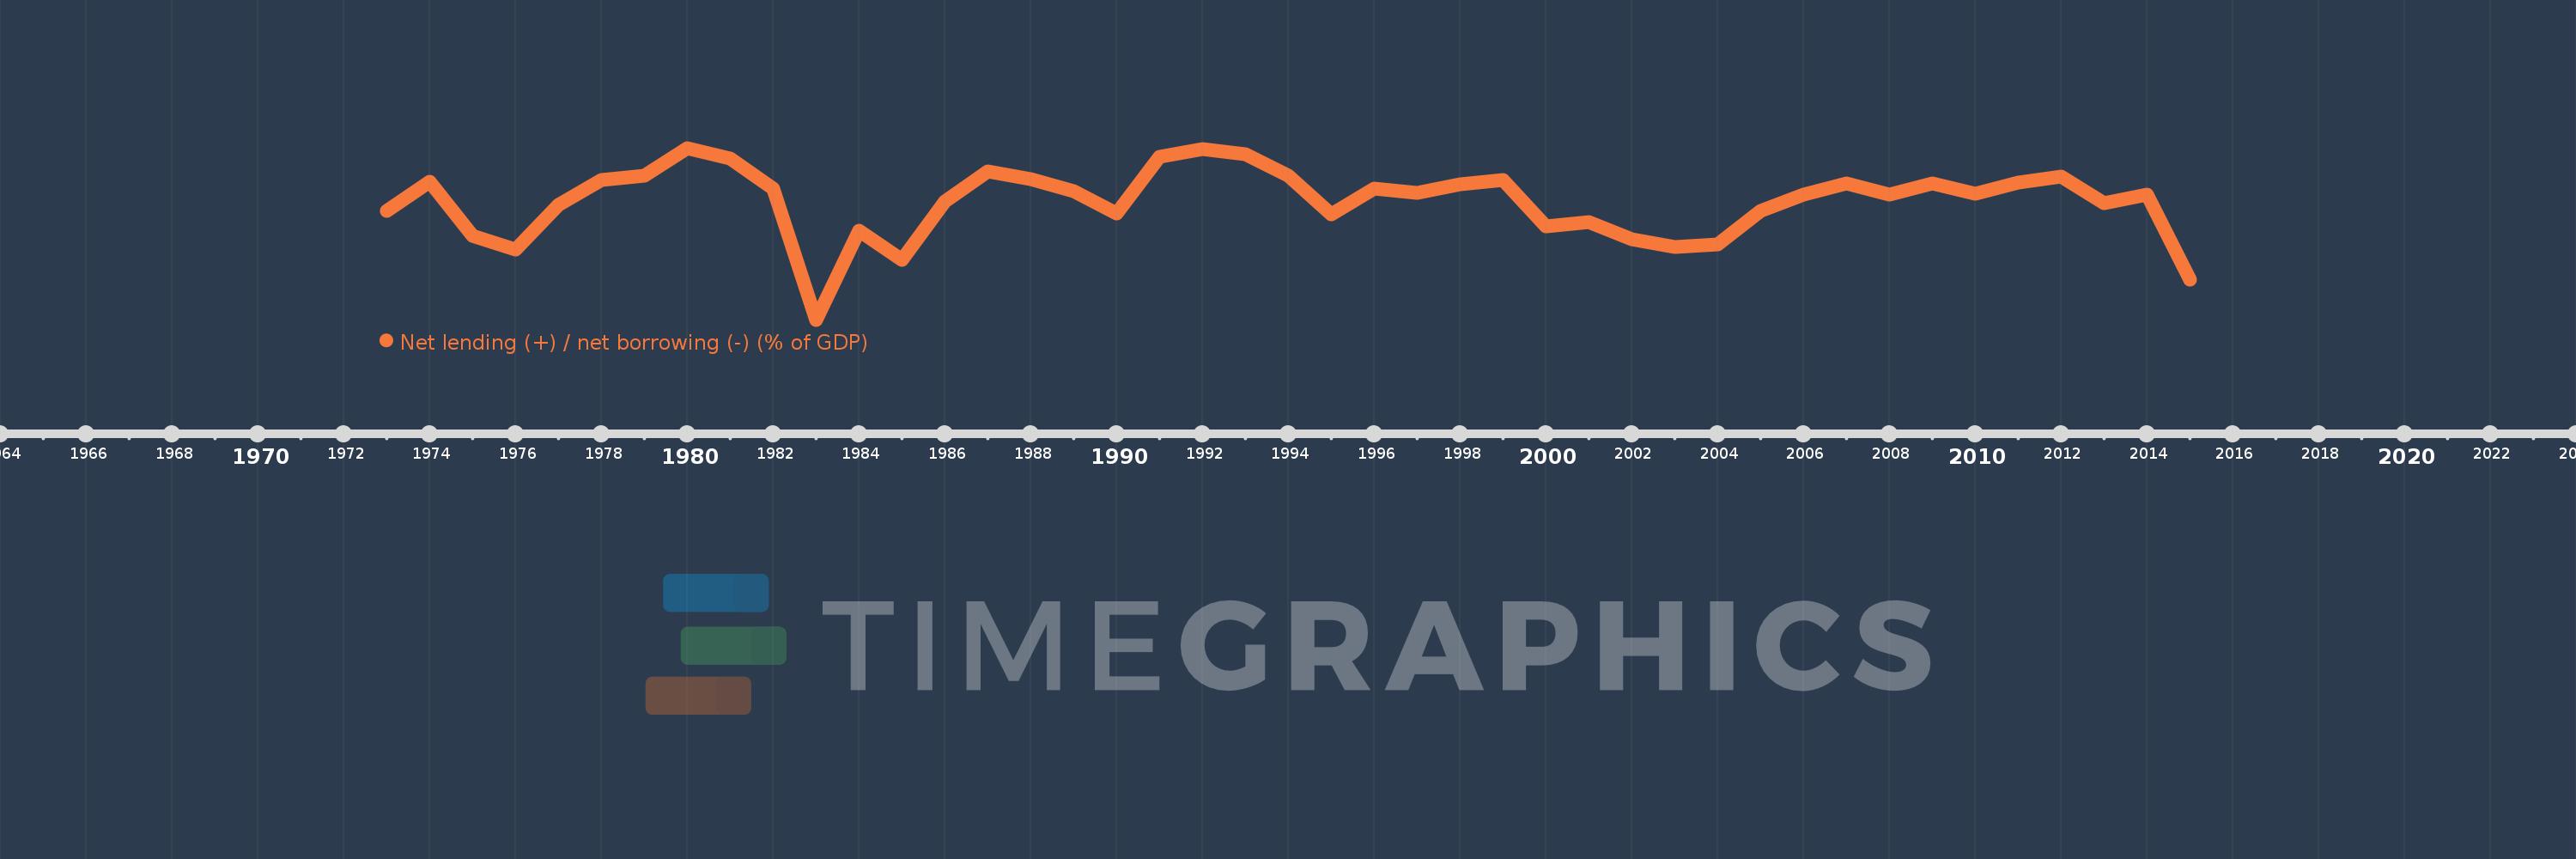
Net lending (+) / net borrowing (-) (% of GDP)
2015,2014,2013,2012,2011,2010,2009,2008,2007,2006,2005,2004,2003,2002,2001,2000,1999,1998,1997,1996,1995,1994,1993,1992,1991,1990,1989,1988,1987,1986,1985,1984,1983,1982,1981,1980,1979,1978,1977,1976,1975,1974,1973
Cette statistique dans les autres pays:
AfghanistanAlbaniaAlgeriaAngolaAntigua and BarbudaArmeniaAustraliaAustriaAzerbaijanBahamas, TheBahrainBangladeshBarbadosBelarusBelgiumBelizeBhutanBoliviaBosnia and HerzegovinaBrazilBurundiCabo VerdeCambodiaCanadaCaribbean small statesCentral African RepublicCentral Europe and the BalticsChileCongo, Dem. Rep.Congo, Rep.Costa RicaCote d'IvoireCroatiaCyprusCzech RepublicDenmarkDominicaDominican RepublicEarly-demographic dividendEgypt, Arab Rep.El SalvadorEquatorial GuineaEstoniaEthiopiaEuro areaEurope & Central AsiaEurope & Central Asia (excluding high income)Europe & Central Asia (IDA & IBRD countries)European UnionFijiFinlandFranceGambia, TheGeorgiaGermanyGreeceGuatemalaHigh incomeHondurasHungaryIcelandIDA blendIndiaIndonesiaIran, Islamic Rep.IraqIrelandIsraelItalyJamaicaKazakhstanKiribatiKorea, Rep.Kyrgyz RepublicLao PDRLatin America & Caribbean Latin America & Caribbean (excluding high income)Latin America & the Caribbean (IDA & IBRD countries)LatviaLebanonLithuaniaLower middle incomeLuxembourgMacao SAR, ChinaMacedonia, FYRMadagascarMalawiMaldivesMaliMaltaMauritiusMexicoMicronesia, Fed. Sts.Middle East & North Africa (excluding high income)Middle East & North Africa (IDA & IBRD countries)MoldovaMongoliaMoroccoMozambiqueNamibiaNepalNetherlandsNew ZealandNicaraguaNigeriaNorth AmericaNorwayOECD membersOmanOther small statesPacific island small statesPakistanParaguayPeruPhilippinesPolandPortugalPost-demographic dividendQatarRomaniaRussian FederationRwandaSamoaSan MarinoSao Tome and PrincipeSenegalSerbiaSierra LeoneSingaporeSlovak RepublicSmall statesSolomon IslandsSouth AfricaSouth AsiaSouth Asia (IDA & IBRD)SpainSri LankaSub-Saharan Africa Sub-Saharan Africa (excluding high income)Sub-Saharan Africa (IDA & IBRD countries)SurinameSwazilandSwedenSwitzerlandSyrian Arab RepublicThailandTimor-LesteTrinidad and TobagoTurkeyUgandaUkraineUnited Arab EmiratesUnited KingdomUnited StatesUruguayVanuatuVietnamWest Bank and GazaWorldYemen, Rep.Zimbabwe La ligne de temps
Cette échelle de temps montre un graphique de 1973 année à 2015 année Uruguay. Les données jusqu'à 1972 année ne sont pas présentés. Quantité d'observations actuelles selon dates: 43.
Source (désignation):
Les indicateurs du développement mondiale
Source (organisation):
International Monetary Fund, Government Finance Statistics Yearbook and data files.
Catégories:
Public Sector
Dernière mise à jour
23 avr. 2017
Les indicateurs de changement de valeurs selon les années
Minimum:
-8.378
1 janv. 1983
Maximum:
1.018
1 janv. 1980
Pour la date d''observation
Valeur
Changement absolu
Le changement par rapport à la valeur précédente
1 janv. 1973
-2.409
-2.409
0.0%
1 janv. 1974
-0.824
+1.585
-65.8%
1 janv. 1975
-3.784
-2.96
359.24%
1 janv. 1976
-4.525
-0.741
19.59%
1 janv. 1977
-2.097
+2.428
-53.65%
1 janv. 1978
-0.722
+1.376
-65.59%
1 janv. 1979
-0.49
+0.232
-32.08%
1 janv. 1980
1.018
+1.508
-307.64%
1 janv. 1981
0.422
-0.596
-58.56%
1 janv. 1982
-1.182
-1.604
-380.26%
1 janv. 1983
-8.378
-7.195
608.54%
1 janv. 1984
-3.515
+4.862
-58.04%
1 janv. 1985
-5.113
-1.597
45.43%
1 janv. 1986
-1.899
+3.214
-62.86%
1 janv. 1987
-0.277
+1.622
-85.4%
1 janv. 1988
-0.677
-0.4
144.28%
1 janv. 1989
-1.363
-0.686
101.24%
1 janv. 1990
-2.575
-1.212
88.93%
1 janv. 1991
0.543
+3.118
-121.07%
1 janv. 1992
0.964
+0.422
77.71%
1 janv. 1993
0.657
-0.307
-31.84%
1 janv. 1994
-0.514
-1.171
-178.24%
1 janv. 1995
-2.619
-2.104
409.28%
1 janv. 1996
-1.197
+1.421
-54.27%
1 janv. 1997
-1.455
-0.257
21.49%
1 janv. 1998
-0.971
+0.483
-33.23%
1 janv. 1999
-0.756
+0.215
-22.19%
1 janv. 2000
-3.266
-2.51
332.16%
1 janv. 2001
-3.014
+0.252
-7.73%
1 janv. 2002
-3.997
-0.984
32.64%
1 janv. 2003
-4.396
-0.399
9.98%
1 janv. 2004
-4.243
+0.153
-3.48%
1 janv. 2005
-2.424
+1.819
-42.87%
1 janv. 2006
-1.523
+0.901
-37.16%
1 janv. 2007
-0.909
+0.614
-40.33%
1 janv. 2008
-1.536
-0.627
68.95%
1 janv. 2009
-0.912
+0.624
-40.62%
1 janv. 2010
-1.475
-0.563
61.73%
1 janv. 2011
-0.898
+0.577
-39.11%
1 janv. 2012
-0.564
+0.334
-37.16%
1 janv. 2013
-2.019
-1.455
257.85%
1 janv. 2014
-1.518
+0.501
-24.84%
1 janv. 2015
-6.162
-4.644
306.04%
Classement des pays selon les statistiques actuelles par années


Commentaires: