30
/fr/
AIzaSyAYiBZKx7MnpbEhh9jyipgxe19OcubqV5w
April 1, 2024
152876
Hungary
HUN
true
2
1
Net lending (+) / net borrowing (-) (% of GDP)
2015,2014,2013,2012,2011,2010,2009,2008,2007,2006,2005,2004,2003,2002,2001,2000,1999,1998,1997,1996,1995,1994,1993,1992
Download
Bibliothèque de statistiques globales →Hungary →

Net lending (+) / net borrowing (-) (% of GDP)

Cette statistique dans les autres pays:

AfghanistanAlbaniaAlgeriaAngolaAntigua and BarbudaArmeniaAustraliaAustriaAzerbaijanBahamas, TheBahrainBangladeshBarbadosBelarusBelgiumBelizeBhutanBoliviaBosnia and HerzegovinaBrazilBurundiCabo VerdeCambodiaCanadaCaribbean small statesCentral African RepublicCentral Europe and the BalticsChileCongo, Dem. Rep.Congo, Rep.Costa RicaCote d'IvoireCroatiaCyprusCzech RepublicDenmarkDominicaDominican RepublicEarly-demographic dividendEgypt, Arab Rep.El SalvadorEquatorial GuineaEstoniaEthiopiaEuro areaEurope & Central AsiaEurope & Central Asia (excluding high income)Europe & Central Asia (IDA & IBRD countries)European UnionFijiFinlandFranceGambia, TheGeorgiaGermanyGreeceGuatemalaHigh incomeHondurasHungaryIcelandIDA blendIndiaIndonesiaIran, Islamic Rep.IraqIrelandIsraelItalyJamaicaKazakhstanKiribatiKorea, Rep.Kyrgyz RepublicLao PDRLatin America & Caribbean Latin America & Caribbean (excluding high income)Latin America & the Caribbean (IDA & IBRD countries)LatviaLebanonLithuaniaLower middle incomeLuxembourgMacao SAR, ChinaMacedonia, FYRMadagascarMalawiMaldivesMaliMaltaMauritiusMexicoMicronesia, Fed. Sts.Middle East & North Africa (excluding high income)Middle East & North Africa (IDA & IBRD countries)MoldovaMongoliaMoroccoMozambiqueNamibiaNepalNetherlandsNew ZealandNicaraguaNigeriaNorth AmericaNorwayOECD membersOmanOther small statesPacific island small statesPakistanParaguayPeruPhilippinesPolandPortugalPost-demographic dividendQatarRomaniaRussian FederationRwandaSamoaSan MarinoSao Tome and PrincipeSenegalSerbiaSierra LeoneSingaporeSlovak RepublicSmall statesSolomon IslandsSouth AfricaSouth AsiaSouth Asia (IDA & IBRD)SpainSri LankaSub-Saharan Africa Sub-Saharan Africa (excluding high income)Sub-Saharan Africa (IDA & IBRD countries)SurinameSwazilandSwedenSwitzerlandSyrian Arab RepublicThailandTimor-LesteTrinidad and TobagoTurkeyUgandaUkraineUnited Arab EmiratesUnited KingdomUnited StatesUruguayVanuatuVietnamWest Bank and GazaWorldYemen, Rep.Zimbabwe

La ligne de temps

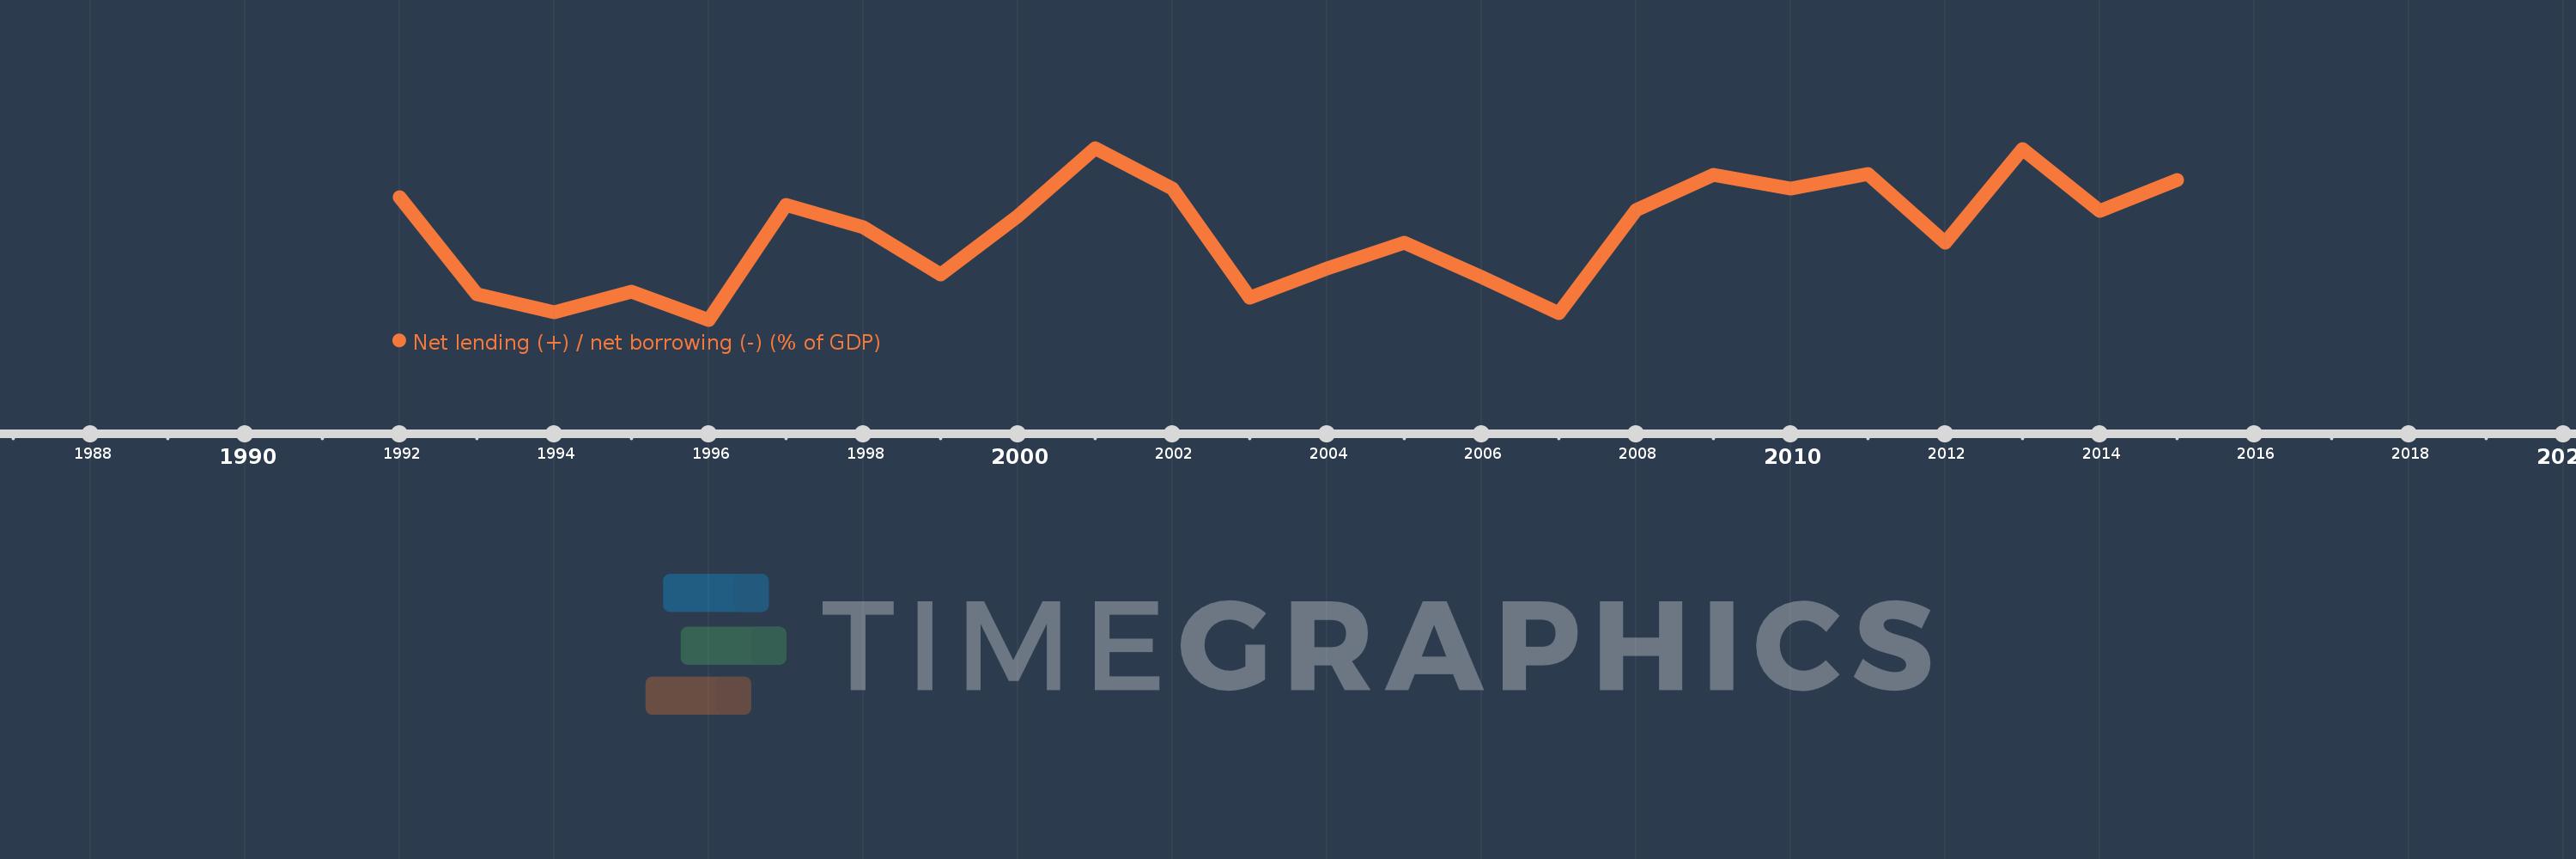
Cette échelle de temps montre un graphique de 1992 année à 2015 année Hungary. Les données jusqu'à 1991 année ne sont pas présentés. Quantité d'observations actuelles selon dates: 24.

Source (désignation):

Les indicateurs du développement mondiale

Source (organisation):

International Monetary Fund, Government Finance Statistics Yearbook and data files.

Catégories:

Public Sector

Dernière mise à jour

23 avr. 2017

Les indicateurs de changement de valeurs selon les années

En moyenne:
-5.749
Minimum:
-8.763
1 janv. 1996
Maximum:
-2.764
1 janv. 2001
Pour la date d''observation
Valeur
Changement absolu
Le changement par rapport à la valeur précédente
1 janv. 1992
-4.468
-4.468
0.0%
1 janv. 1993
-7.878
-3.41
76.33%
1 janv. 1994
-8.497
-0.618
7.85%
1 janv. 1995
-7.778
+0.719
-8.46%
1 janv. 1996
-8.763
-0.985
12.66%
1 janv. 1997
-4.76
+4.003
-45.69%
1 janv. 1998
-5.52
-0.761
15.99%
1 janv. 1999
-7.168
-1.647
29.84%
1 janv. 2000
-5.139
+2.028
-28.3%
1 janv. 2001
-2.764
+2.375
-46.22%
1 janv. 2002
-4.172
-1.408
50.95%
1 janv. 2003
-7.988
-3.816
91.46%
1 janv. 2004
-6.986
+1.003
-12.55%
1 janv. 2005
-6.069
+0.916
-13.12%
1 janv. 2006
-7.278
-1.209
19.92%
1 janv. 2007
-8.531
-1.253
17.22%
1 janv. 2008
-4.947
+3.584
-42.01%
1 janv. 2009
-3.702
+1.245
-25.17%
1 janv. 2010
-4.189
-0.487
13.15%
1 janv. 2011
-3.665
+0.524
-12.51%
1 janv. 2012
-6.064
-2.399
65.46%
1 janv. 2013
-2.798
+3.266
-53.86%
1 janv. 2014
-4.977
-2.179
77.88%
1 janv. 2015
-3.871
+1.107
-22.24%

Classement des pays selon les statistiques actuelles par années