29
/fr/
fr
AIzaSyAYiBZKx7MnpbEhh9jyipgxe19OcubqV5w
April 1, 2024
275739
United Kingdom
GBR
true
2
1
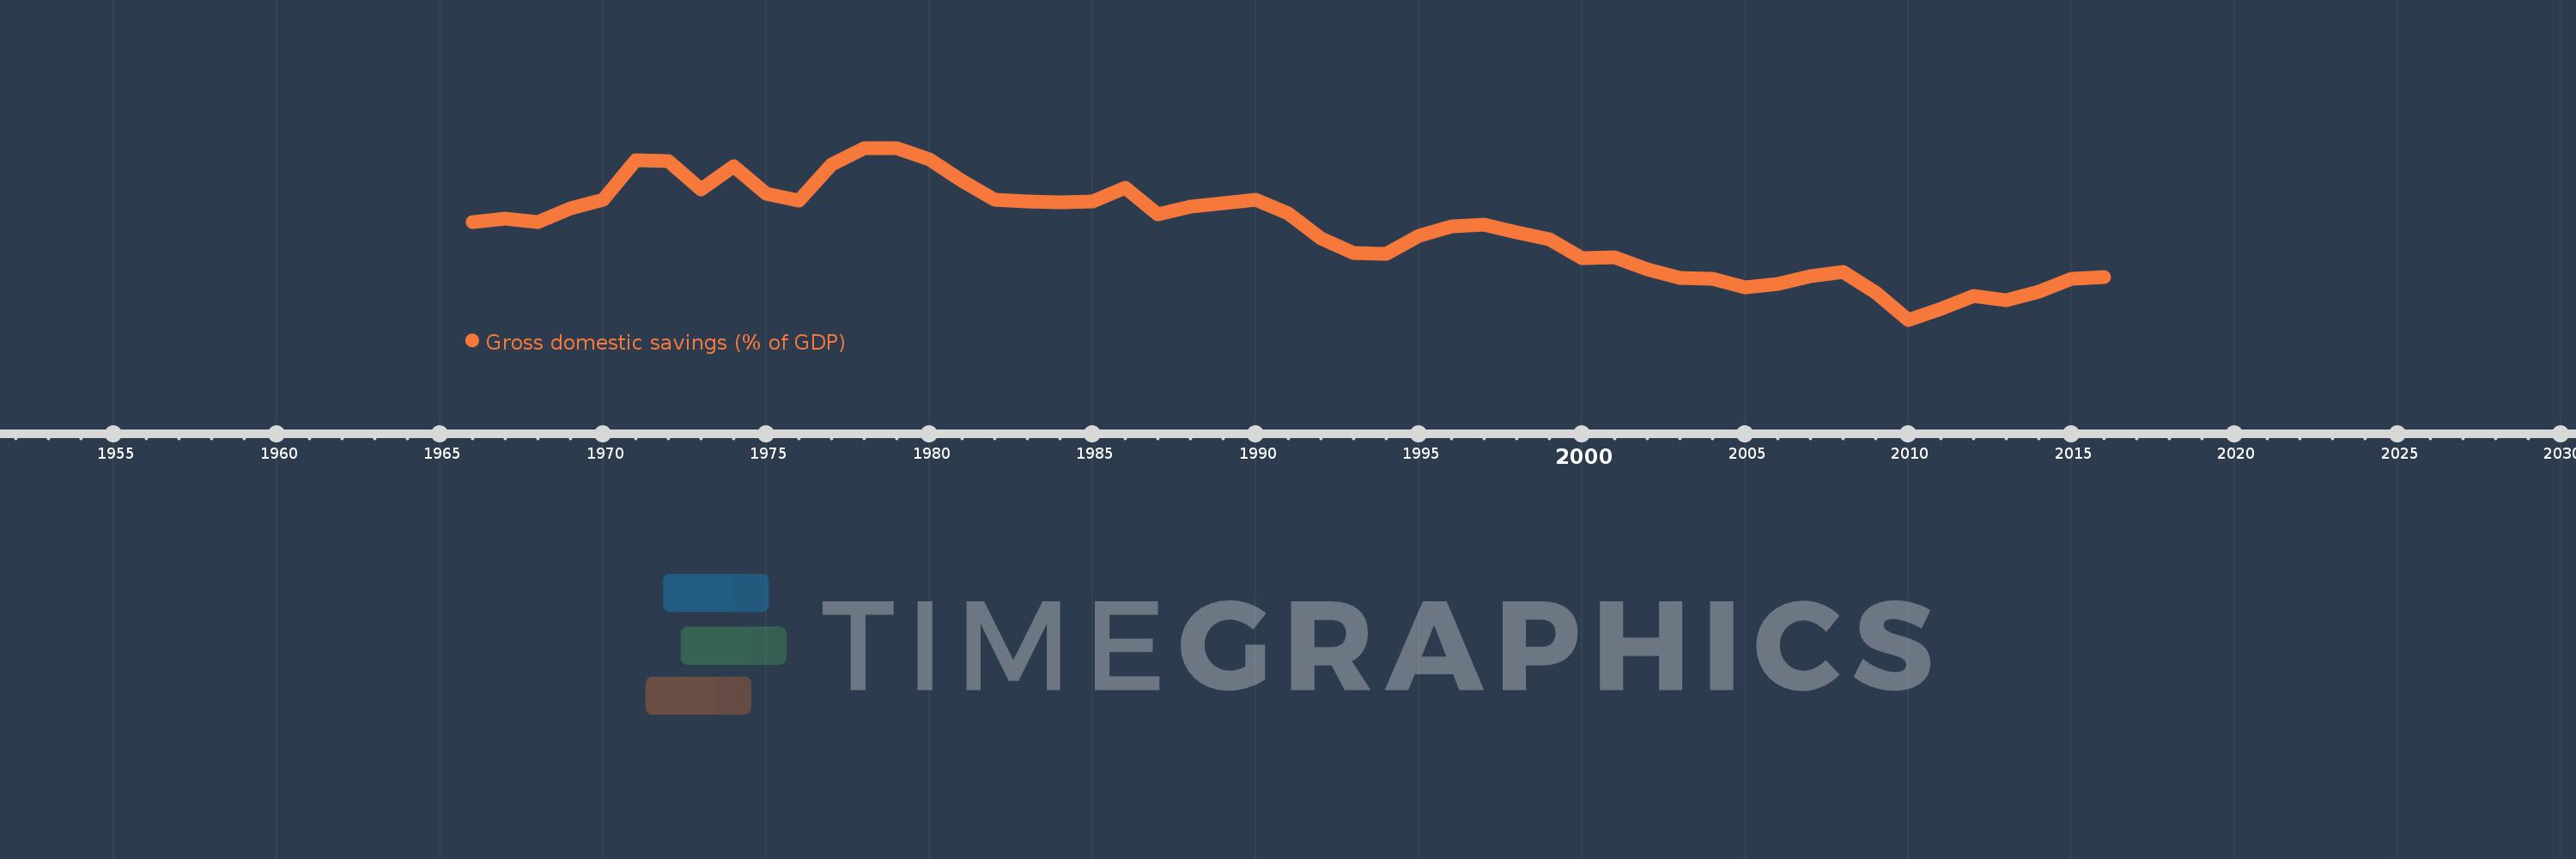
Gross domestic savings (% of GDP)
2016,2015,2014,2013,2012,2011,2010,2009,2008,2007,2006,2005,2004,2003,2002,2001,2000,1999,1998,1997,1996,1995,1994,1993,1992,1991,1990,1989,1988,1987,1986,1985,1984,1983,1982,1981,1980,1979,1978,1977,1976,1975,1974,1973,1972,1971,1970,1969,1968,1967,1966
Cette statistique dans les autres pays:
AfghanistanAlbaniaAlgeriaAngolaAntigua and BarbudaArab WorldArgentinaArmeniaArubaAustraliaAustriaAzerbaijanBahamas, TheBahrainBangladeshBarbadosBelarusBelgiumBelizeBeninBermudaBhutanBoliviaBosnia and HerzegovinaBotswanaBrazilBrunei DarussalamBulgariaBurkina FasoBurundiCabo VerdeCambodiaCameroonCanadaCaribbean small statesCentral African RepublicCentral Europe and the BalticsChadChileChinaColombiaComorosCongo, Dem. Rep.Congo, Rep.Costa RicaCote d'IvoireCroatiaCubaCyprusCzech RepublicDenmarkDjiboutiDominicaDominican RepublicEarly-demographic dividendEast Asia & PacificEast Asia & Pacific (excluding high income)East Asia & Pacific (IDA & IBRD countries)EcuadorEgypt, Arab Rep.El SalvadorEquatorial GuineaEritreaEstoniaEthiopiaEuro areaEurope & Central AsiaEurope & Central Asia (excluding high income)Europe & Central Asia (IDA & IBRD countries)European UnionFaroe IslandsFijiFinlandFragile and conflict affected situationsFranceGabonGambia, TheGeorgiaGermanyGhanaGreeceGrenadaGuatemalaGuineaGuinea-BissauGuyanaHaitiHeavily indebted poor countries (HIPC)High incomeHondurasHong Kong SAR, ChinaHungaryIBRD onlyIcelandIDA & IBRD totalIDA blendIDA onlyIDA totalIndiaIndonesiaIran, Islamic Rep.IraqIrelandIsraelItalyJamaicaJapanJordanKazakhstanKenyaKiribatiKorea, Rep.KosovoKuwaitKyrgyz RepublicLao PDRLate-demographic dividendLatin America & Caribbean Latin America & Caribbean (excluding high income)Latin America & the Caribbean (IDA & IBRD countries)LatviaLeast developed countries: UN classificationLebanonLesothoLiberiaLibyaLithuaniaLow & middle incomeLow incomeLower middle incomeLuxembourgMacao SAR, ChinaMacedonia, FYRMadagascarMalawiMalaysiaMaldivesMaliMaltaMauritaniaMauritiusMexicoMicronesia, Fed. Sts.Middle East & North AfricaMiddle East & North Africa (excluding high income)Middle East & North Africa (IDA & IBRD countries)Middle incomeMoldovaMongoliaMontenegroMoroccoMozambiqueNamibiaNepalNetherlandsNew CaledoniaNew ZealandNicaraguaNigerNigeriaNorth AmericaNorwayOECD membersOmanOther small statesPacific island small statesPakistanPanamaPapua New GuineaParaguayPeruPhilippinesPolandPortugalPost-demographic dividendPre-demographic dividendPuerto RicoQatarRomaniaRussian FederationRwandaSaudi ArabiaSenegalSerbiaSeychellesSierra LeoneSingaporeSlovak RepublicSloveniaSmall statesSolomon IslandsSomaliaSouth AfricaSouth AsiaSouth Asia (IDA & IBRD)South SudanSpainSri LankaSt. Kitts and NevisSt. LuciaSt. Vincent and the GrenadinesSub-Saharan Africa Sub-Saharan Africa (excluding high income)Sub-Saharan Africa (IDA & IBRD countries)SudanSurinameSwazilandSwedenSwitzerlandSyrian Arab RepublicTajikistanTanzaniaThailandTimor-LesteTogoTongaTrinidad and TobagoTunisiaTurkeyTurkmenistanUgandaUkraineUnited Arab EmiratesUnited KingdomUnited StatesUpper middle incomeUruguayUzbekistanVanuatuVenezuela, RBVietnamWest Bank and GazaWorldYemen, Rep.ZambiaZimbabwe La ligne de temps
Cette échelle de temps montre un graphique de 1966 année à 2016 année United Kingdom. Les données jusqu'à 1965 année ne sont pas présentés. Quantité d'observations actuelles selon dates: 51.
Source (désignation):
Les indicateurs du développement mondiale
Source (organisation):
World Bank national accounts data, and OECD National Accounts data files.
Catégories:
Economy & Growth
Dernière mise à jour
23 avr. 2017
Les indicateurs de changement de valeurs selon les années
Minimum:
12.473
1 janv. 2010
Maximum:
24.711
1 janv. 1979
Pour la date d''observation
Valeur
Changement absolu
Le changement par rapport à la valeur précédente
1 janv. 1966
19.449
+19.449
0.0%
1 janv. 1967
19.669
+0.22
1.13%
1 janv. 1968
19.45
-0.219
-1.11%
1 janv. 1969
20.414
+0.964
4.96%
1 janv. 1970
21.006
+0.593
2.9%
1 janv. 1971
23.83
+2.823
13.44%
1 janv. 1972
23.789
-0.041
-0.17%
1 janv. 1973
21.776
-2.013
-8.46%
1 janv. 1974
23.387
+1.611
7.4%
1 janv. 1975
21.459
-1.928
-8.25%
1 janv. 1976
20.933
-0.526
-2.45%
1 janv. 1977
23.506
+2.573
12.29%
1 janv. 1978
24.697
+1.191
5.07%
1 janv. 1979
24.711
+0.014
0.06%
1 janv. 1980
23.926
-0.785
-3.18%
1 janv. 1981
22.397
-1.528
-6.39%
1 janv. 1982
21.041
-1.356
-6.06%
1 janv. 1983
20.894
-0.147
-0.7%
1 janv. 1984
20.847
-0.047
-0.23%
1 janv. 1985
20.9
+0.054
0.26%
1 janv. 1986
21.864
+0.964
4.61%
1 janv. 1987
19.961
-1.903
-8.7%
1 janv. 1988
20.525
+0.563
2.82%
1 janv. 1989
20.805
+0.28
1.36%
1 janv. 1990
21.037
+0.232
1.12%
1 janv. 1991
20.062
-0.975
-4.63%
1 janv. 1992
18.291
-1.771
-8.83%
1 janv. 1993
17.238
-1.053
-5.76%
1 janv. 1994
17.152
-0.086
-0.5%
1 janv. 1995
18.437
+1.285
7.49%
1 janv. 1996
19.135
+0.697
3.78%
1 janv. 1997
19.235
+0.1
0.52%
1 janv. 1998
18.725
-0.51
-2.65%
1 janv. 1999
18.176
-0.549
-2.93%
1 janv. 2000
16.846
-1.329
-7.31%
1 janv. 2001
16.911
+0.065
0.38%
1 janv. 2002
16.052
-0.858
-5.08%
1 janv. 2003
15.478
-0.575
-3.58%
1 janv. 2004
15.399
-0.079
-0.51%
1 janv. 2005
14.78
-0.619
-4.02%
1 janv. 2006
15.011
+0.23
1.56%
1 janv. 2007
15.549
+0.538
3.59%
1 janv. 2008
15.891
+0.343
2.2%
1 janv. 2009
14.396
-1.496
-9.41%
1 janv. 2010
12.473
-1.923
-13.36%
1 janv. 2011
13.268
+0.795
6.37%
1 janv. 2012
14.197
+0.929
7.0%
1 janv. 2013
13.86
-0.337
-2.37%
1 janv. 2014
14.452
+0.592
4.27%
1 janv. 2015
15.421
+0.969
6.71%
1 janv. 2016
15.523
+0.102
0.66%
Classement des pays selon les statistiques actuelles par années


Commentaires: