29
/fr/
fr
AIzaSyAYiBZKx7MnpbEhh9jyipgxe19OcubqV5w
April 1, 2024
258369
Syrian Arab Republic
SYR
true
2
1
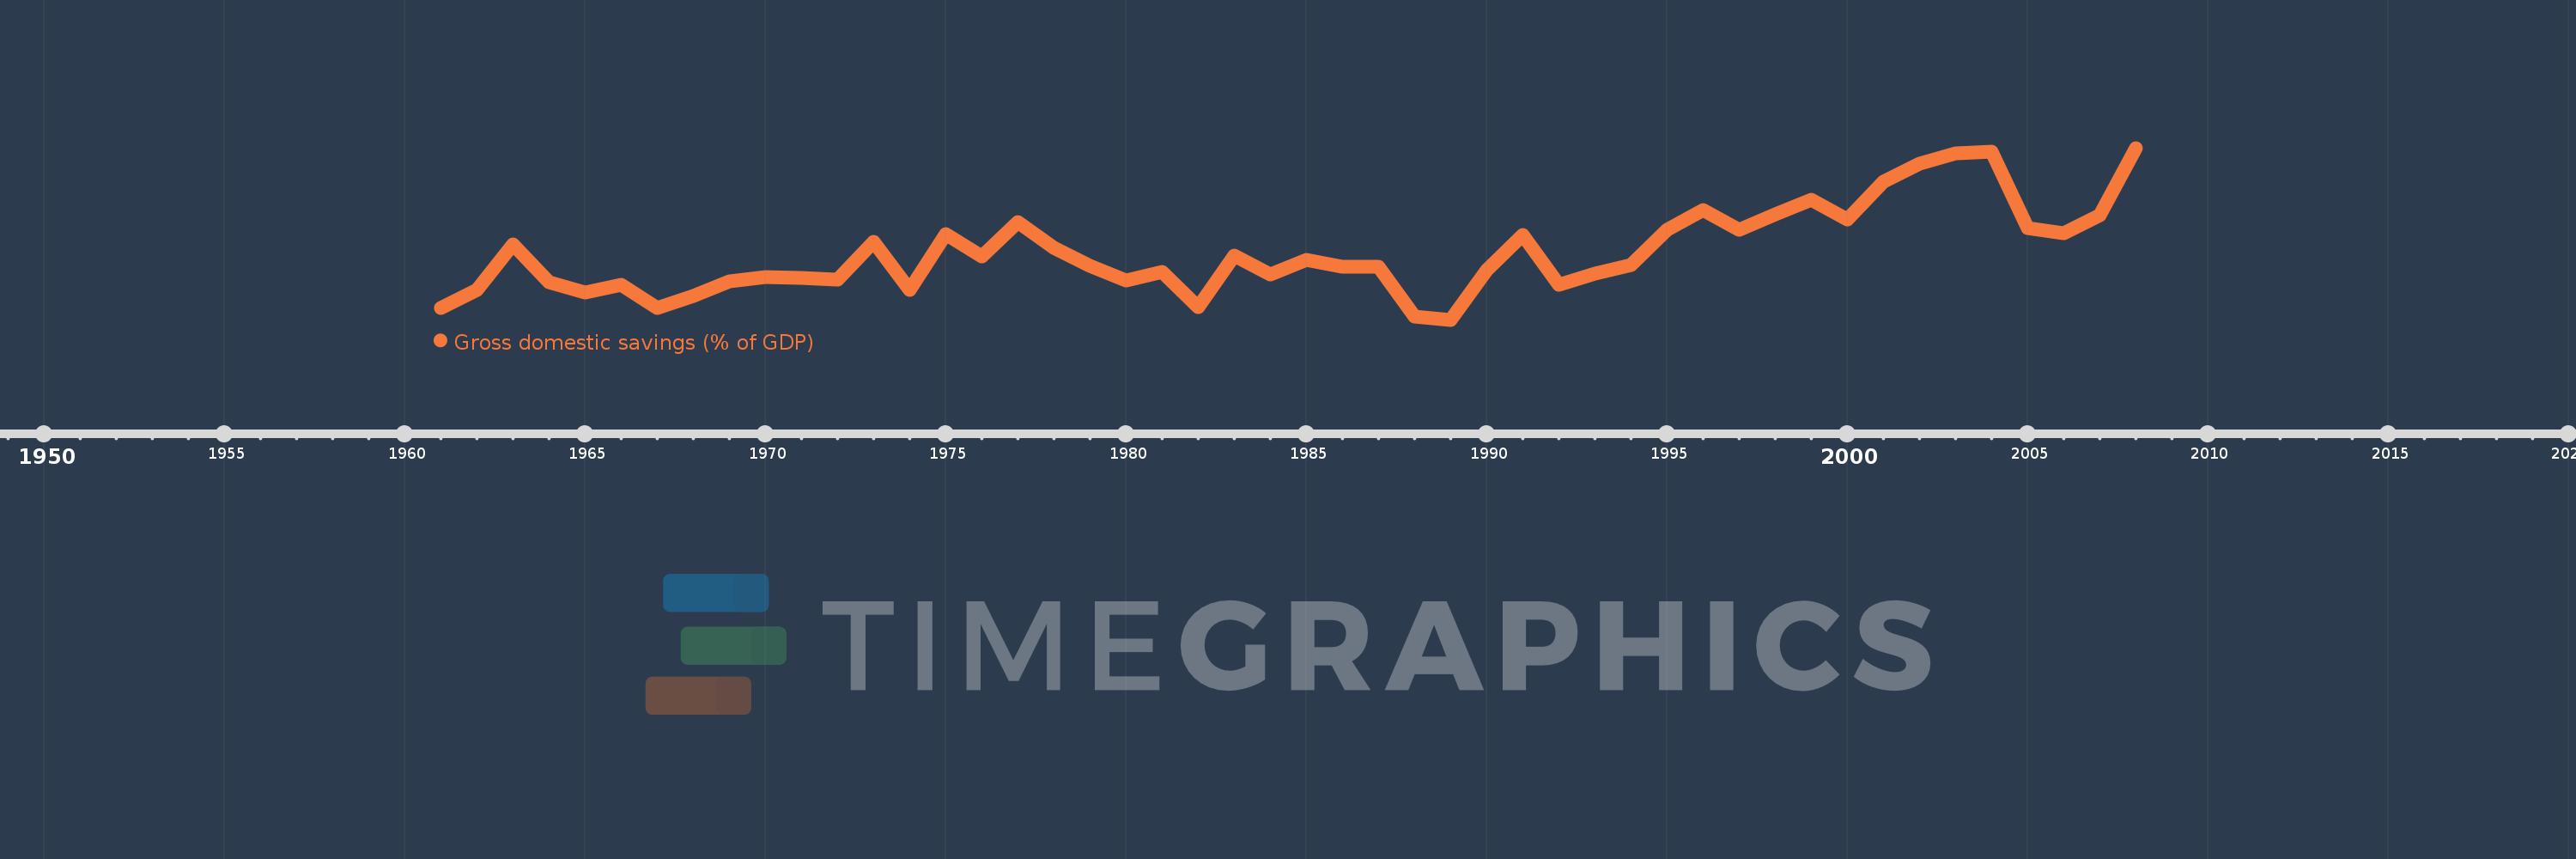
Gross domestic savings (% of GDP)
2008,2007,2006,2005,2004,2003,2002,2001,2000,1999,1998,1997,1996,1995,1994,1993,1992,1991,1990,1989,1988,1987,1986,1985,1984,1983,1982,1981,1980,1979,1978,1977,1976,1975,1974,1973,1972,1971,1970,1969,1968,1967,1966,1965,1964,1963,1962,1961
Cette statistique dans les autres pays:
AfghanistanAlbaniaAlgeriaAngolaAntigua and BarbudaArab WorldArgentinaArmeniaArubaAustraliaAustriaAzerbaijanBahamas, TheBahrainBangladeshBarbadosBelarusBelgiumBelizeBeninBermudaBhutanBoliviaBosnia and HerzegovinaBotswanaBrazilBrunei DarussalamBulgariaBurkina FasoBurundiCabo VerdeCambodiaCameroonCanadaCaribbean small statesCentral African RepublicCentral Europe and the BalticsChadChileChinaColombiaComorosCongo, Dem. Rep.Congo, Rep.Costa RicaCote d'IvoireCroatiaCubaCyprusCzech RepublicDenmarkDjiboutiDominicaDominican RepublicEarly-demographic dividendEast Asia & PacificEast Asia & Pacific (excluding high income)East Asia & Pacific (IDA & IBRD countries)EcuadorEgypt, Arab Rep.El SalvadorEquatorial GuineaEritreaEstoniaEthiopiaEuro areaEurope & Central AsiaEurope & Central Asia (excluding high income)Europe & Central Asia (IDA & IBRD countries)European UnionFaroe IslandsFijiFinlandFragile and conflict affected situationsFranceGabonGambia, TheGeorgiaGermanyGhanaGreeceGrenadaGuatemalaGuineaGuinea-BissauGuyanaHaitiHeavily indebted poor countries (HIPC)High incomeHondurasHong Kong SAR, ChinaHungaryIBRD onlyIcelandIDA & IBRD totalIDA blendIDA onlyIDA totalIndiaIndonesiaIran, Islamic Rep.IraqIrelandIsraelItalyJamaicaJapanJordanKazakhstanKenyaKiribatiKorea, Rep.KosovoKuwaitKyrgyz RepublicLao PDRLate-demographic dividendLatin America & Caribbean Latin America & Caribbean (excluding high income)Latin America & the Caribbean (IDA & IBRD countries)LatviaLeast developed countries: UN classificationLebanonLesothoLiberiaLibyaLithuaniaLow & middle incomeLow incomeLower middle incomeLuxembourgMacao SAR, ChinaMacedonia, FYRMadagascarMalawiMalaysiaMaldivesMaliMaltaMauritaniaMauritiusMexicoMicronesia, Fed. Sts.Middle East & North AfricaMiddle East & North Africa (excluding high income)Middle East & North Africa (IDA & IBRD countries)Middle incomeMoldovaMongoliaMontenegroMoroccoMozambiqueNamibiaNepalNetherlandsNew CaledoniaNew ZealandNicaraguaNigerNigeriaNorth AmericaNorwayOECD membersOmanOther small statesPacific island small statesPakistanPanamaPapua New GuineaParaguayPeruPhilippinesPolandPortugalPost-demographic dividendPre-demographic dividendPuerto RicoQatarRomaniaRussian FederationRwandaSaudi ArabiaSenegalSerbiaSeychellesSierra LeoneSingaporeSlovak RepublicSloveniaSmall statesSolomon IslandsSomaliaSouth AfricaSouth AsiaSouth Asia (IDA & IBRD)South SudanSpainSri LankaSt. Kitts and NevisSt. LuciaSt. Vincent and the GrenadinesSub-Saharan Africa Sub-Saharan Africa (excluding high income)Sub-Saharan Africa (IDA & IBRD countries)SudanSurinameSwazilandSwedenSwitzerlandSyrian Arab RepublicTajikistanTanzaniaThailandTimor-LesteTogoTongaTrinidad and TobagoTunisiaTurkeyTurkmenistanUgandaUkraineUnited Arab EmiratesUnited KingdomUnited StatesUpper middle incomeUruguayUzbekistanVanuatuVenezuela, RBVietnamWest Bank and GazaWorldYemen, Rep.ZambiaZimbabwe La ligne de temps
Cette échelle de temps montre un graphique de 1961 année à 2008 année Syrian Arab Republic. Les données jusqu'à 1960 année ne sont pas présentés. Quantité d'observations actuelles selon dates: 48.
Source (désignation):
Les indicateurs du développement mondiale
Source (organisation):
World Bank national accounts data, and OECD National Accounts data files.
Catégories:
Economy & Growth
Dernière mise à jour
23 avr. 2017
Les indicateurs de changement de valeurs selon les années
Minimum:
5.637
1 janv. 1989
Maximum:
28.61
1 janv. 2008
Pour la date d''observation
Valeur
Changement absolu
Le changement par rapport à la valeur précédente
1 janv. 1961
7.264
+7.264
0.0%
1 janv. 1962
9.641
+2.377
32.72%
1 janv. 1963
15.675
+6.035
62.6%
1 janv. 1964
10.675
-5.0
-31.9%
1 janv. 1965
9.244
-1.431
-13.4%
1 janv. 1966
10.335
+1.09
11.79%
1 janv. 1967
7.197
-3.137
-30.36%
1 janv. 1968
8.863
+1.665
23.14%
1 janv. 1969
10.752
+1.889
21.32%
1 janv. 1970
11.392
+0.64
5.95%
1 janv. 1971
11.207
-0.185
-1.62%
1 janv. 1972
10.95
-0.258
-2.3%
1 janv. 1973
16.109
+5.159
47.11%
1 janv. 1974
9.65
-6.459
-40.1%
1 janv. 1975
17.059
+7.409
76.78%
1 janv. 1976
14.121
-2.938
-17.22%
1 janv. 1977
18.683
+4.562
32.3%
1 janv. 1978
15.253
-3.43
-18.36%
1 janv. 1979
12.791
-2.462
-16.14%
1 janv. 1980
10.927
-1.864
-14.57%
1 janv. 1981
12.057
+1.131
10.35%
1 janv. 1982
7.282
-4.775
-39.6%
1 janv. 1983
14.196
+6.914
94.94%
1 janv. 1984
11.672
-2.525
-17.78%
1 janv. 1985
13.683
+2.011
17.23%
1 janv. 1986
12.689
-0.994
-7.26%
1 janv. 1987
12.687
-0.002
-0.01%
1 janv. 1988
6.027
-6.661
-52.5%
1 janv. 1989
5.637
-0.39
-6.46%
1 janv. 1990
12.242
+6.605
117.18%
1 janv. 1991
16.933
+4.691
38.32%
1 janv. 1992
10.303
-6.631
-39.16%
1 janv. 1993
11.799
+1.496
14.52%
1 janv. 1994
12.935
+1.136
9.63%
1 janv. 1995
17.628
+4.694
36.29%
1 janv. 1996
20.303
+2.675
15.17%
1 janv. 1997
17.638
-2.665
-13.13%
1 janv. 1998
19.719
+2.081
11.8%
1 janv. 1999
21.708
+1.99
10.09%
1 janv. 2000
19.091
-2.618
-12.06%
1 janv. 2001
24.075
+4.985
26.11%
1 janv. 2002
26.488
+2.412
10.02%
1 janv. 2003
27.851
+1.363
5.15%
1 janv. 2004
28.146
+0.295
1.06%
1 janv. 2005
17.899
-10.247
-36.41%
1 janv. 2006
17.17
-0.729
-4.07%
1 janv. 2007
19.636
+2.466
14.36%
1 janv. 2008
28.61
+8.974
45.7%
Classement des pays selon les statistiques actuelles par années


Commentaires: