29
/fr/
fr
AIzaSyAYiBZKx7MnpbEhh9jyipgxe19OcubqV5w
April 1, 2024
272312
Uganda
UGA
true
2
1
Gross national expenditure (constant 2010 US$)
2016,2015,2014,2013,2012,2011,2010,2009,2008,2007,2006,2005,2004,2003,2002,2001,2000,1999,1998,1997,1996,1995,1994,1993,1992,1991,1990,1989,1988,1987,1986,1985,1984,1983
Cette statistique dans les autres pays:
AfghanistanAlbaniaAlgeriaAngolaAntigua and BarbudaArab WorldArgentinaArmeniaArubaAustraliaAustriaAzerbaijanBahamas, TheBahrainBangladeshBarbadosBelarusBelgiumBelizeBeninBermudaBhutanBoliviaBosnia and HerzegovinaBotswanaBrazilBrunei DarussalamBulgariaBurkina FasoBurundiCabo VerdeCambodiaCameroonCanadaCaribbean small statesCentral African RepublicCentral Europe and the BalticsChadChileChinaColombiaComorosCongo, Dem. Rep.Congo, Rep.Costa RicaCote d'IvoireCroatiaCubaCyprusCzech RepublicDenmarkDominicaDominican RepublicEarly-demographic dividendEast Asia & PacificEast Asia & Pacific (excluding high income)East Asia & Pacific (IDA & IBRD countries)EcuadorEgypt, Arab Rep.El SalvadorEquatorial GuineaEritreaEstoniaEuro areaEurope & Central AsiaEurope & Central Asia (excluding high income)Europe & Central Asia (IDA & IBRD countries)European UnionFaroe IslandsFijiFinlandFragile and conflict affected situationsFranceGabonGambia, TheGeorgiaGermanyGhanaGreeceGrenadaGuatemalaGuineaGuinea-BissauGuyanaHaitiHeavily indebted poor countries (HIPC)High incomeHondurasHong Kong SAR, ChinaHungaryIBRD onlyIcelandIDA & IBRD totalIDA blendIDA onlyIDA totalIndiaIndonesiaIran, Islamic Rep.IraqIrelandIsraelItalyJamaicaJapanJordanKazakhstanKenyaKiribatiKorea, Rep.KosovoKuwaitKyrgyz RepublicLao PDRLate-demographic dividendLatin America & Caribbean Latin America & Caribbean (excluding high income)Latin America & the Caribbean (IDA & IBRD countries)LatviaLeast developed countries: UN classificationLebanonLiberiaLibyaLithuaniaLow & middle incomeLow incomeLower middle incomeLuxembourgMacao SAR, ChinaMacedonia, FYRMadagascarMalawiMalaysiaMaldivesMaliMaltaMauritaniaMauritiusMexicoMiddle East & North AfricaMiddle East & North Africa (excluding high income)Middle East & North Africa (IDA & IBRD countries)Middle incomeMoldovaMongoliaMontenegroMoroccoMozambiqueMyanmarNamibiaNepalNetherlandsNew ZealandNicaraguaNigerNigeriaNorth AmericaNorwayOECD membersOmanOther small statesPacific island small statesPakistanPalauPanamaParaguayPeruPhilippinesPolandPortugalPost-demographic dividendPre-demographic dividendPuerto RicoQatarRomaniaRussian FederationRwandaSamoaSaudi ArabiaSenegalSerbiaSeychellesSierra LeoneSingaporeSlovak RepublicSloveniaSmall statesSolomon IslandsSouth AfricaSouth AsiaSouth Asia (IDA & IBRD)South SudanSpainSri LankaSt. Kitts and NevisSt. LuciaSt. Vincent and the GrenadinesSub-Saharan Africa Sub-Saharan Africa (excluding high income)Sub-Saharan Africa (IDA & IBRD countries)SudanSurinameSwazilandSwedenSwitzerlandTajikistanTanzaniaThailandTimor-LesteTogoTongaTrinidad and TobagoTunisiaTurkeyTurkmenistanUgandaUkraineUnited Arab EmiratesUnited KingdomUnited StatesUpper middle incomeUruguayUzbekistanVanuatuVenezuela, RBVietnamWest Bank and GazaWorldYemen, Rep.ZambiaZimbabwe La ligne de temps
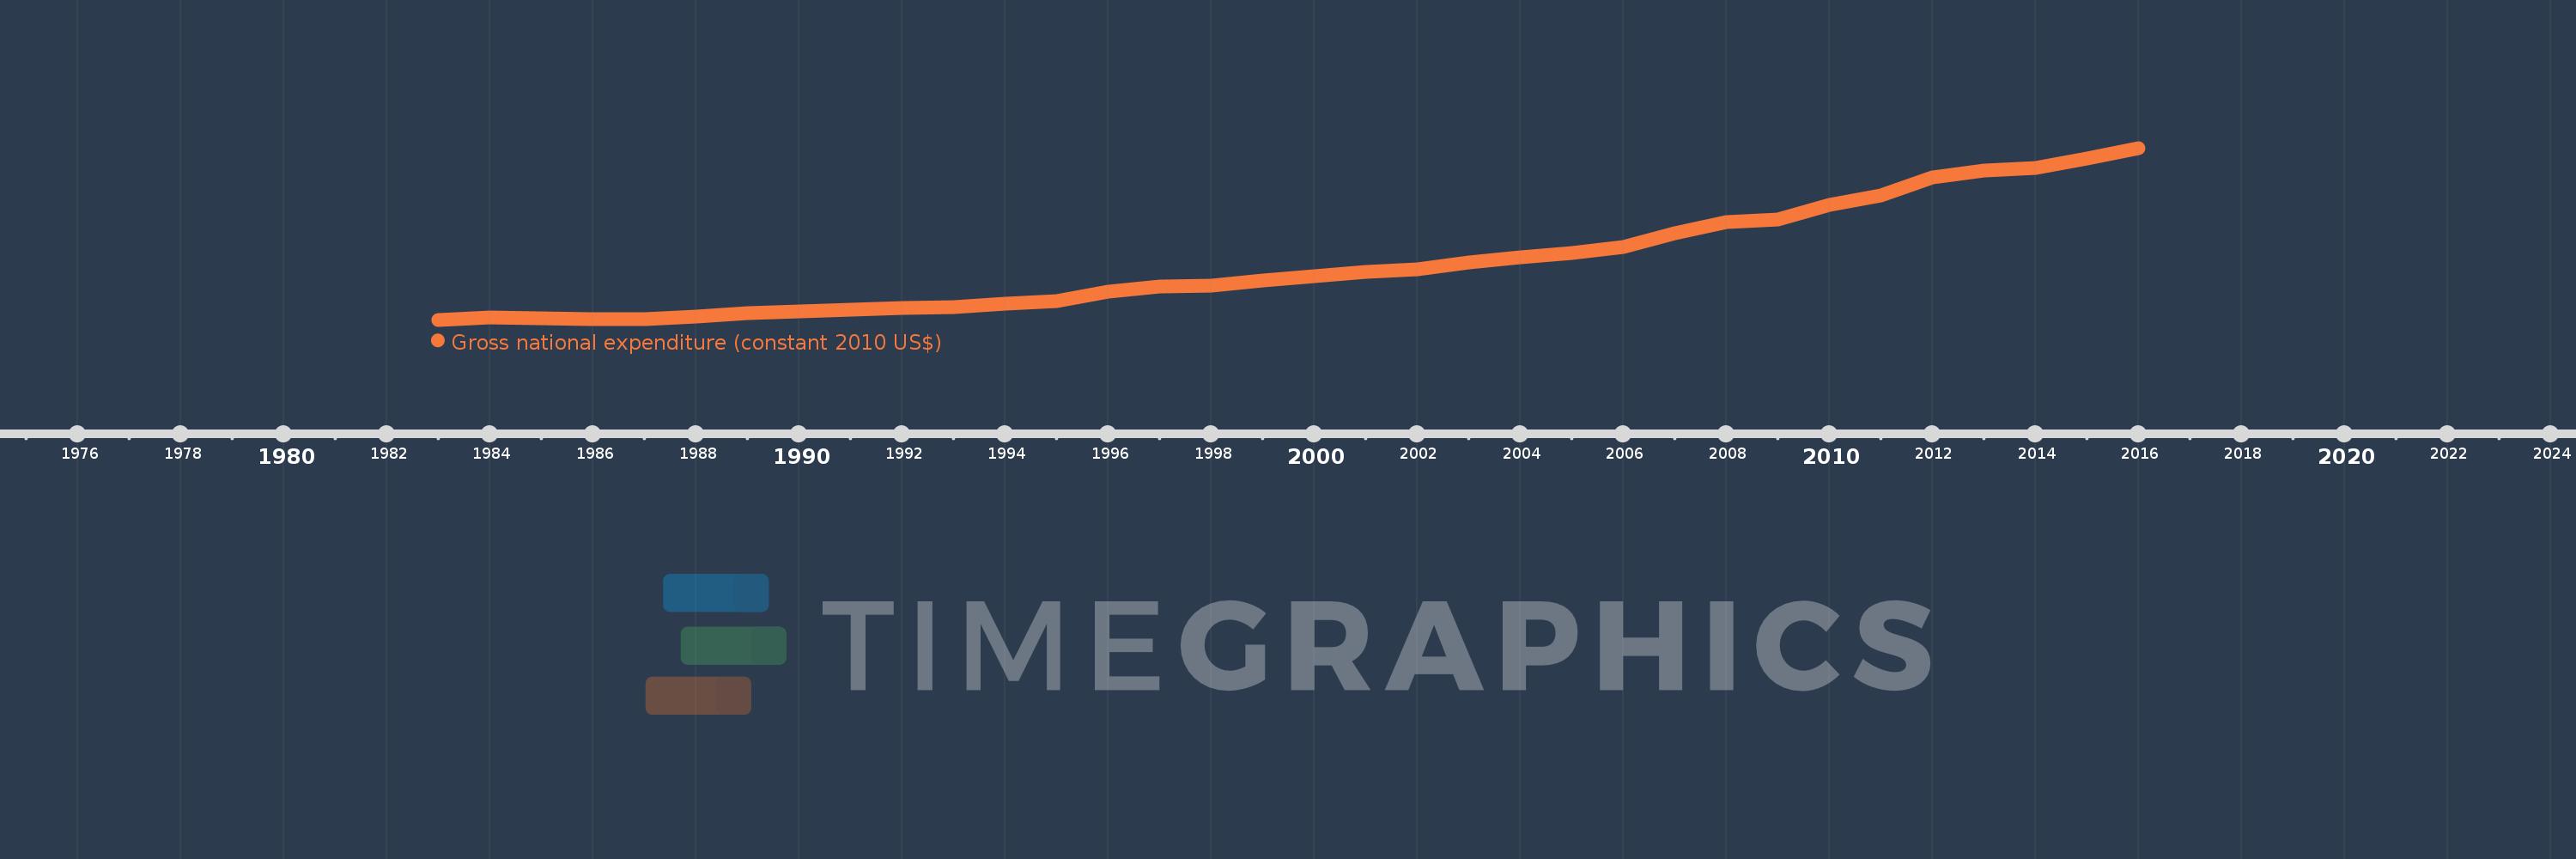
Cette échelle de temps montre un graphique de 1983 année à 2016 année Uganda. Les données jusqu'à 1982 année ne sont pas présentés. Quantité d'observations actuelles selon dates: 34.
Source (désignation):
Les indicateurs du développement mondiale
Source (organisation):
World Bank national accounts data, and OECD National Accounts data files.
Catégories:
Economy & Growth
Dernière mise à jour
23 avr. 2017
Les indicateurs de changement de valeurs selon les années
Minimum:
4.592 mds
1 janv. 1983
Maximum:
28.98 mds
1 janv. 2016
Pour la date d''observation
Valeur
Changement absolu
Le changement par rapport à la valeur précédente
1 janv. 1983
4.592 mds
+4.592 mds
0.0%
1 janv. 1984
4.885 mds
+292.947 mln.
6.38%
1 janv. 1985
4.803 mds
-82.226 mln.
-1.68%
1 janv. 1986
4.672 mds
-130.949 mln.
-2.73%
1 janv. 1987
4.711 mds
+38.856 mln.
0.83%
1 janv. 1988
5.036 mds
+325.182 mln.
6.9%
1 janv. 1989
5.496 mds
+459.432 mln.
9.12%
1 janv. 1990
5.747 mds
+251.544 mln.
4.58%
1 janv. 1991
6.036 mds
+288.687 mln.
5.02%
1 janv. 1992
6.295 mds
+259.401 mln.
4.3%
1 janv. 1993
6.418 mds
+123.068 mln.
1.95%
1 janv. 1994
6.878 mds
+460.158 mln.
7.17%
1 janv. 1995
7.28 mds
+401.927 mln.
5.84%
1 janv. 1996
8.531 mds
+1.251 mds
17.18%
1 janv. 1997
9.264 mds
+733.059 mln.
8.59%
1 janv. 1998
9.486 mds
+221.716 mln.
2.39%
1 janv. 1999
10.114 mds
+627.334 mln.
6.61%
1 janv. 2000
10.79 mds
+676.182 mln.
6.69%
1 janv. 2001
11.366 mds
+576.082 mln.
5.34%
1 janv. 2002
11.797 mds
+431.078 mln.
3.79%
1 janv. 2003
12.757 mds
+960.342 mln.
8.14%
1 janv. 2004
13.462 mds
+705.272 mln.
5.53%
1 janv. 2005
14.008 mds
+545.844 mln.
4.05%
1 janv. 2006
14.93 mds
+921.297 mln.
6.58%
1 janv. 2007
16.866 mds
+1.936 mds
12.97%
1 janv. 2008
18.503 mds
+1.637 mds
9.71%
1 janv. 2009
18.781 mds
+277.757 mln.
1.5%
1 janv. 2010
20.869 mds
+2.088 mds
11.12%
1 janv. 2011
22.247 mds
+1.378 mds
6.6%
1 janv. 2012
24.79 mds
+2.543 mds
11.43%
1 janv. 2013
25.75 mds
+960.696 mln.
3.88%
1 janv. 2014
26.144 mds
+393.551 mln.
1.53%
1 janv. 2015
27.532 mds
+1.388 mds
5.31%
1 janv. 2016
28.98 mds
+1.448 mds
5.26%
Classement des pays selon les statistiques actuelles par années


Commentaires: