29
/fr/
fr
AIzaSyAYiBZKx7MnpbEhh9jyipgxe19OcubqV5w
April 1, 2024
136796
Gambia, The
GMB
true
2
1
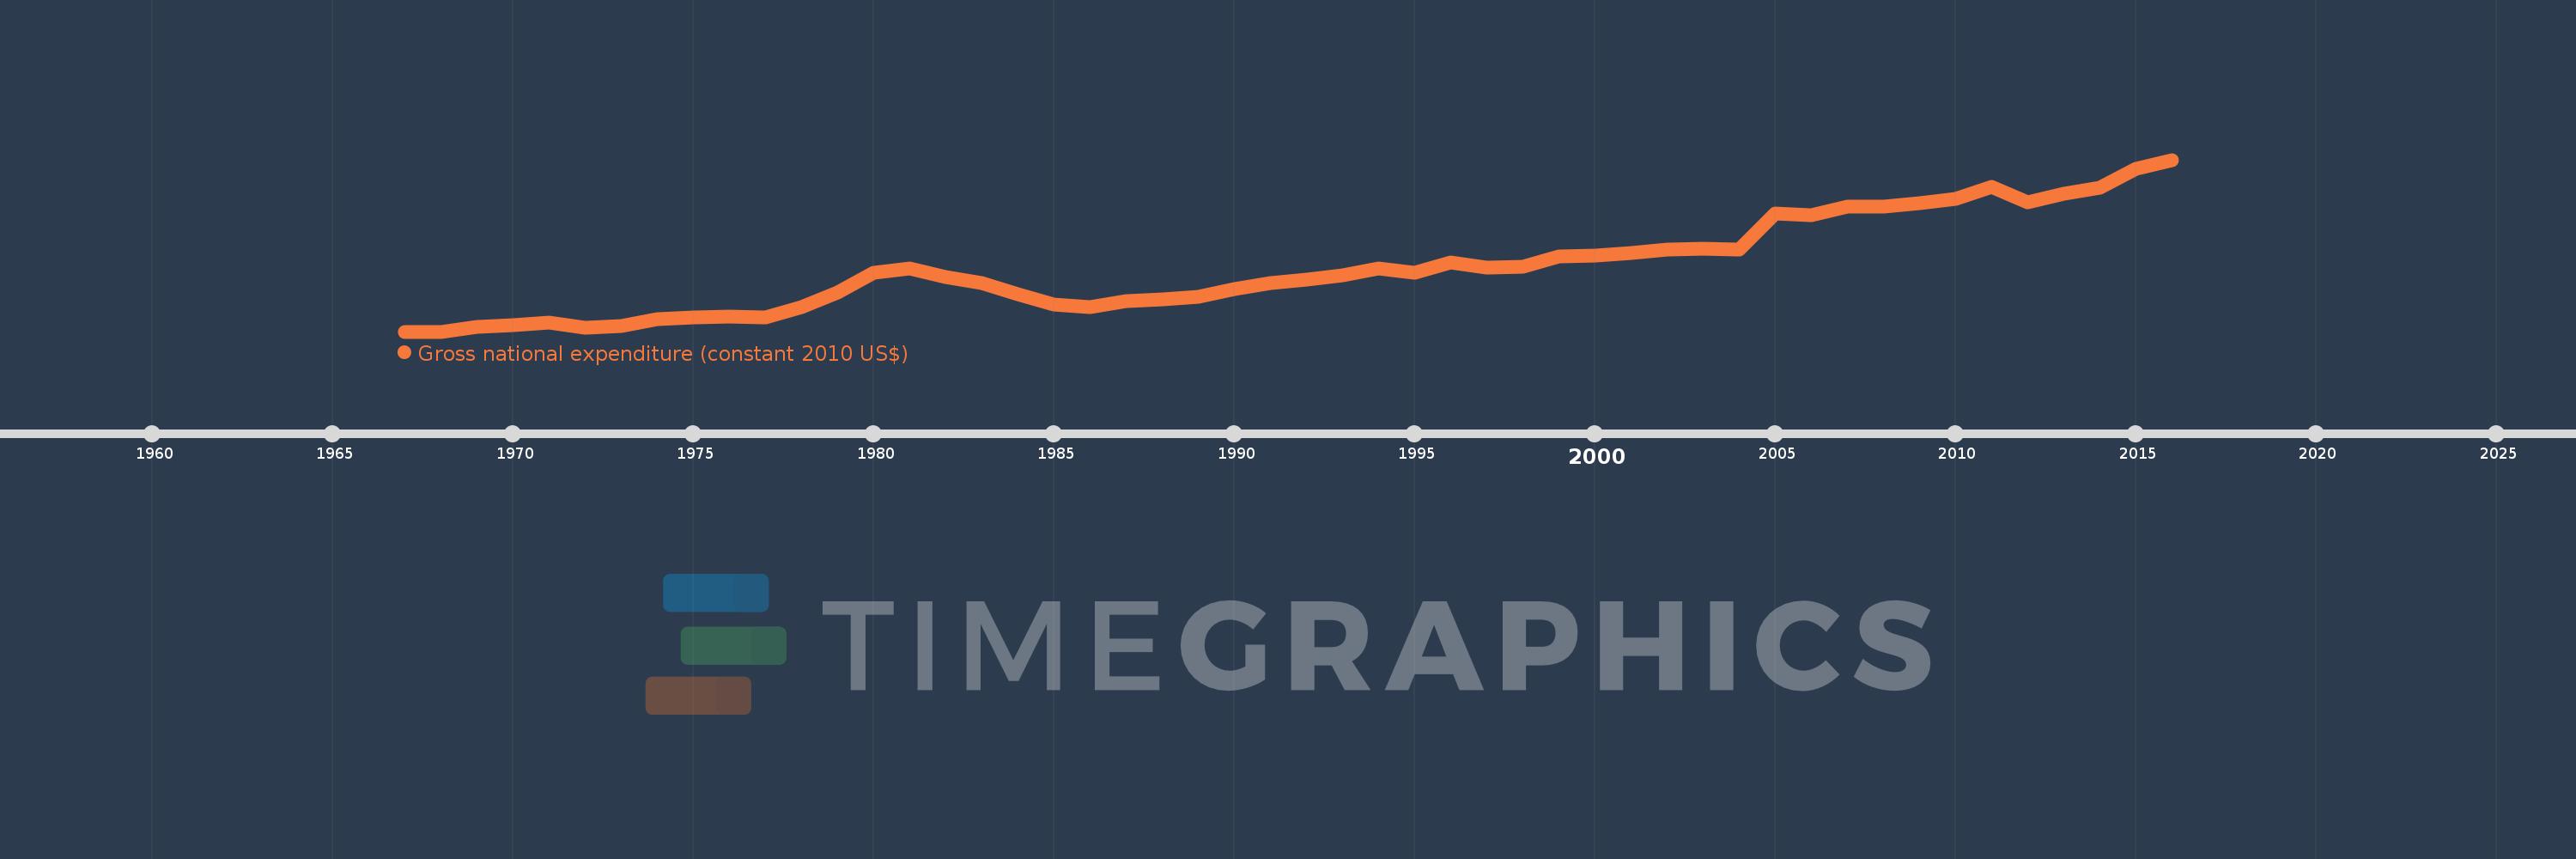
Gross national expenditure (constant 2010 US$)
2016,2015,2014,2013,2012,2011,2010,2009,2008,2007,2006,2005,2004,2003,2002,2001,2000,1999,1998,1997,1996,1995,1994,1993,1992,1991,1990,1989,1988,1987,1986,1985,1984,1983,1982,1981,1980,1979,1978,1977,1976,1975,1974,1973,1972,1971,1970,1969,1968,1967
Cette statistique dans les autres pays:
AfghanistanAlbaniaAlgeriaAngolaAntigua and BarbudaArab WorldArgentinaArmeniaArubaAustraliaAustriaAzerbaijanBahamas, TheBahrainBangladeshBarbadosBelarusBelgiumBelizeBeninBermudaBhutanBoliviaBosnia and HerzegovinaBotswanaBrazilBrunei DarussalamBulgariaBurkina FasoBurundiCabo VerdeCambodiaCameroonCanadaCaribbean small statesCentral African RepublicCentral Europe and the BalticsChadChileChinaColombiaComorosCongo, Dem. Rep.Congo, Rep.Costa RicaCote d'IvoireCroatiaCubaCyprusCzech RepublicDenmarkDominicaDominican RepublicEarly-demographic dividendEast Asia & PacificEast Asia & Pacific (excluding high income)East Asia & Pacific (IDA & IBRD countries)EcuadorEgypt, Arab Rep.El SalvadorEquatorial GuineaEritreaEstoniaEuro areaEurope & Central AsiaEurope & Central Asia (excluding high income)Europe & Central Asia (IDA & IBRD countries)European UnionFaroe IslandsFijiFinlandFragile and conflict affected situationsFranceGabonGambia, TheGeorgiaGermanyGhanaGreeceGrenadaGuatemalaGuineaGuinea-BissauGuyanaHaitiHeavily indebted poor countries (HIPC)High incomeHondurasHong Kong SAR, ChinaHungaryIBRD onlyIcelandIDA & IBRD totalIDA blendIDA onlyIDA totalIndiaIndonesiaIran, Islamic Rep.IraqIrelandIsraelItalyJamaicaJapanJordanKazakhstanKenyaKiribatiKorea, Rep.KosovoKuwaitKyrgyz RepublicLao PDRLate-demographic dividendLatin America & Caribbean Latin America & Caribbean (excluding high income)Latin America & the Caribbean (IDA & IBRD countries)LatviaLeast developed countries: UN classificationLebanonLiberiaLibyaLithuaniaLow & middle incomeLow incomeLower middle incomeLuxembourgMacao SAR, ChinaMacedonia, FYRMadagascarMalawiMalaysiaMaldivesMaliMaltaMauritaniaMauritiusMexicoMiddle East & North AfricaMiddle East & North Africa (excluding high income)Middle East & North Africa (IDA & IBRD countries)Middle incomeMoldovaMongoliaMontenegroMoroccoMozambiqueMyanmarNamibiaNepalNetherlandsNew ZealandNicaraguaNigerNigeriaNorth AmericaNorwayOECD membersOmanOther small statesPacific island small statesPakistanPalauPanamaParaguayPeruPhilippinesPolandPortugalPost-demographic dividendPre-demographic dividendPuerto RicoQatarRomaniaRussian FederationRwandaSamoaSaudi ArabiaSenegalSerbiaSeychellesSierra LeoneSingaporeSlovak RepublicSloveniaSmall statesSolomon IslandsSouth AfricaSouth AsiaSouth Asia (IDA & IBRD)South SudanSpainSri LankaSt. Kitts and NevisSt. LuciaSt. Vincent and the GrenadinesSub-Saharan Africa Sub-Saharan Africa (excluding high income)Sub-Saharan Africa (IDA & IBRD countries)SudanSurinameSwazilandSwedenSwitzerlandTajikistanTanzaniaThailandTimor-LesteTogoTongaTrinidad and TobagoTunisiaTurkeyTurkmenistanUgandaUkraineUnited Arab EmiratesUnited KingdomUnited StatesUpper middle incomeUruguayUzbekistanVanuatuVenezuela, RBVietnamWest Bank and GazaWorldYemen, Rep.ZambiaZimbabwe La ligne de temps
Cette échelle de temps montre un graphique de 1967 année à 2016 année Gambia, The. Les données jusqu'à 1966 année ne sont pas présentés. Quantité d'observations actuelles selon dates: 50.
Source (désignation):
Les indicateurs du développement mondiale
Source (organisation):
World Bank national accounts data, and OECD National Accounts data files.
Catégories:
Economy & Growth
Dernière mise à jour
23 avr. 2017
Les indicateurs de changement de valeurs selon les années
Minimum:
305.159 mln.
1 janv. 1967
Maximum:
1.289 mds
1 janv. 2016
Pour la date d''observation
Valeur
Changement absolu
Le changement par rapport à la valeur précédente
1 janv. 1967
305.159 mln.
+305.159 mln.
0.0%
1 janv. 1968
305.159 mln.
0.0
0.0%
1 janv. 1969
331.777 mln.
+26.619 mln.
8.72%
1 janv. 1970
344.1 mln.
+12.323 mln.
3.71%
1 janv. 1971
355.612 mln.
+11.511 mln.
3.35%
1 janv. 1972
329.626 mln.
-25.986 mln.
-7.31%
1 janv. 1973
336.138 mln.
+6.512 mln.
1.98%
1 janv. 1974
375.66 mln.
+39.522 mln.
11.76%
1 janv. 1975
384.613 mln.
+8.953 mln.
2.38%
1 janv. 1976
392.449 mln.
+7.837 mln.
2.04%
1 janv. 1977
388.638 mln.
-3.811 mln.
-0.97%
1 janv. 1978
447.628 mln.
+58.99 mln.
15.18%
1 janv. 1979
530.301 mln.
+82.673 mln.
18.47%
1 janv. 1980
640.156 mln.
+109.854 mln.
20.72%
1 janv. 1981
665.699 mln.
+25.543 mln.
3.99%
1 janv. 1982
616.689 mln.
-49.01 mln.
-7.36%
1 janv. 1983
580.731 mln.
-35.958 mln.
-5.83%
1 janv. 1984
520.583 mln.
-60.148 mln.
-10.36%
1 janv. 1985
461.095 mln.
-59.488 mln.
-11.43%
1 janv. 1986
444.442 mln.
-16.653 mln.
-3.61%
1 janv. 1987
478.041 mln.
+33.599 mln.
7.56%
1 janv. 1988
491.673 mln.
+13.632 mln.
2.85%
1 janv. 1989
506.6 mln.
+14.927 mln.
3.04%
1 janv. 1990
550.328 mln.
+43.728 mln.
8.63%
1 janv. 1991
581.177 mln.
+30.849 mln.
5.61%
1 janv. 1992
600.677 mln.
+19.499 mln.
3.36%
1 janv. 1993
628.445 mln.
+27.768 mln.
4.62%
1 janv. 1994
664.327 mln.
+35.882 mln.
5.71%
1 janv. 1995
642.851 mln.
-21.477 mln.
-3.23%
1 janv. 1996
700.771 mln.
+57.921 mln.
9.01%
1 janv. 1997
669.91 mln.
-30.861 mln.
-4.4%
1 janv. 1998
675.716 mln.
+5.806 mln.
0.87%
1 janv. 1999
734.492 mln.
+58.775 mln.
8.7%
1 janv. 2000
742.234 mln.
+7.742 mln.
1.05%
1 janv. 2001
753.498 mln.
+11.264 mln.
1.52%
1 janv. 2002
774.363 mln.
+20.865 mln.
2.77%
1 janv. 2003
777.496 mln.
+3.134 mln.
0.4%
1 janv. 2004
774.364 mln.
-3.132 mln.
-0.4%
1 janv. 2005
982.613 mln.
+208.249 mln.
26.89%
1 janv. 2006
971.764 mln.
-10.849 mln.
-1.1%
1 janv. 2007
1.02 mds
+48.348 mln.
4.98%
1 janv. 2008
1.02 mds
-462.533 milles
-0.05%
1 janv. 2009
1.041 mds
+21.01 mln.
2.06%
1 janv. 2010
1.066 mds
+25.232 mln.
2.42%
1 janv. 2011
1.133 mds
+66.746 mln.
6.26%
1 janv. 2012
1.044 mds
-88.348 mln.
-7.8%
1 janv. 2013
1.094 mds
+49.456 mln.
4.74%
1 janv. 2014
1.129 mds
+35.338 mln.
3.23%
1 janv. 2015
1.235 mds
+106.062 mln.
9.39%
1 janv. 2016
1.289 mds
+53.701 mln.
4.35%
Classement des pays selon les statistiques actuelles par années


Commentaires: