29
/fr/
fr
AIzaSyAYiBZKx7MnpbEhh9jyipgxe19OcubqV5w
April 1, 2024
267859
Tunisia
TUN
true
2
1
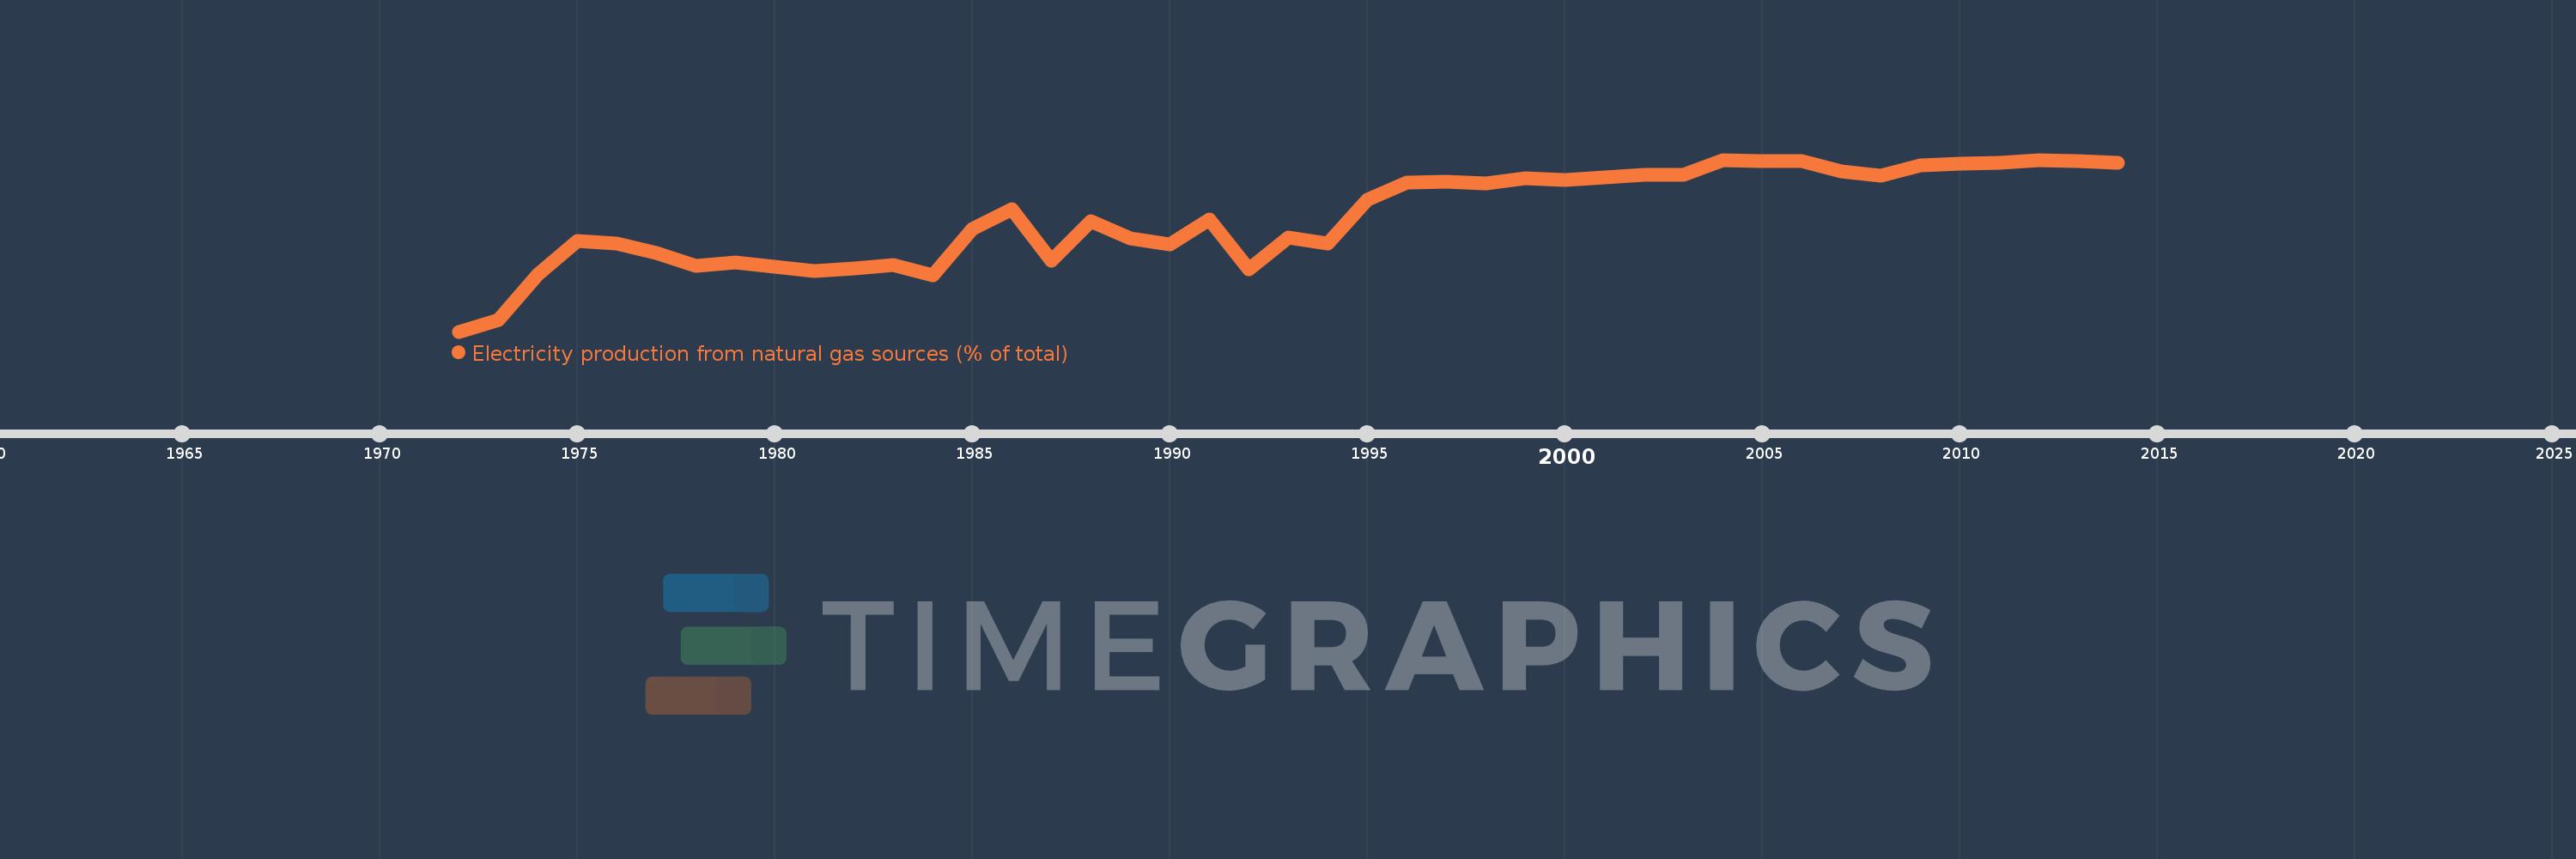
Electricity production from natural gas sources (% of total)
2014,2013,2012,2011,2010,2009,2008,2007,2006,2005,2004,2003,2002,2001,2000,1999,1998,1997,1996,1995,1994,1993,1992,1991,1990,1989,1988,1987,1986,1985,1984,1983,1982,1981,1980,1979,1978,1977,1976,1975,1974,1973,1972
Cette statistique dans les autres pays:
AlbaniaAlgeriaAngolaArab WorldArgentinaArmeniaAustraliaAustriaAzerbaijanBahrainBangladeshBelarusBelgiumBeninBoliviaBosnia and HerzegovinaBotswanaBrazilBrunei DarussalamBulgariaCambodiaCameroonCanadaCentral Europe and the BalticsChileChinaColombiaCongo, Dem. Rep.Congo, Rep.Costa RicaCote d'IvoireCroatiaCubaCuracaoCyprusCzech RepublicDenmarkDominican RepublicEarly-demographic dividendEast Asia & PacificEast Asia & Pacific (excluding high income)East Asia & Pacific (IDA & IBRD countries)EcuadorEgypt, Arab Rep.El SalvadorEritreaEstoniaEthiopiaEuro areaEurope & Central AsiaEurope & Central Asia (excluding high income)Europe & Central Asia (IDA & IBRD countries)European UnionFinlandFragile and conflict affected situationsFranceGabonGeorgiaGermanyGhanaGibraltarGreeceGuatemalaHaitiHeavily indebted poor countries (HIPC)High incomeHondurasHong Kong SAR, ChinaHungaryIBRD onlyIcelandIDA & IBRD totalIDA blendIDA onlyIDA totalIndiaIndonesiaIran, Islamic Rep.IraqIrelandIsraelItalyJamaicaJapanJordanKazakhstanKenyaKorea, Dem. People’s Rep.Korea, Rep.KosovoKuwaitKyrgyz RepublicLate-demographic dividendLatin America & Caribbean Latin America & Caribbean (excluding high income)Latin America & the Caribbean (IDA & IBRD countries)LatviaLeast developed countries: UN classificationLebanonLibyaLithuaniaLow & middle incomeLower middle incomeLuxembourgMacedonia, FYRMalaysiaMaltaMauritiusMexicoMiddle East & North AfricaMiddle East & North Africa (excluding high income)Middle East & North Africa (IDA & IBRD countries)Middle incomeMoldovaMongoliaMontenegroMoroccoMozambiqueMyanmarNamibiaNepalNetherlandsNew ZealandNicaraguaNigerNigeriaNorth AmericaNorwayOECD membersOmanOther small statesPakistanPanamaParaguayPeruPhilippinesPolandPortugalPost-demographic dividendPre-demographic dividendQatarRomaniaRussian FederationSaudi ArabiaSenegalSerbiaSingaporeSlovak RepublicSloveniaSmall statesSouth AfricaSouth AsiaSouth Asia (IDA & IBRD)South SudanSpainSri LankaSub-Saharan Africa Sub-Saharan Africa (excluding high income)Sub-Saharan Africa (IDA & IBRD countries)SudanSwedenSwitzerlandSyrian Arab RepublicTajikistanTanzaniaThailandTogoTrinidad and TobagoTunisiaTurkeyTurkmenistanUkraineUnited Arab EmiratesUnited KingdomUnited StatesUpper middle incomeUruguayUzbekistanVenezuela, RBVietnamWorldYemen, Rep.ZambiaZimbabwe La ligne de temps
Cette échelle de temps montre un graphique de 1972 année à 2014 année Tunisia. Les données jusqu'à 1971 année ne sont pas présentés. Quantité d'observations actuelles selon dates: 43.
Source (désignation):
Les indicateurs du développement mondiale
Source (organisation):
IEA Statistics © OECD/IEA 2014 (http://www.iea.org/stats/index.asp), subject to https://www.iea.org/t&c/termsandconditions/
Catégories:
Energy & Mining, Climate Change, Infrastructure
Dernière mise à jour
23 avr. 2017
Les indicateurs de changement de valeurs selon les années
Maximum:
97.787
1 janv. 2012
Pour la date d''observation
Valeur
Changement absolu
Le changement par rapport à la valeur précédente
1 janv. 1973
6.433
+6.433
%
1 janv. 1974
32.74
+26.306
408.91%
1 janv. 1975
51.577
+18.837
57.54%
1 janv. 1976
50.142
-1.435
-2.78%
1 janv. 1977
44.918
-5.224
-10.42%
1 janv. 1978
37.472
-7.446
-16.58%
1 janv. 1979
39.145
+1.673
4.46%
1 janv. 1980
36.848
-2.297
-5.87%
1 janv. 1981
34.679
-2.17
-5.89%
1 janv. 1982
35.759
+1.081
3.12%
1 janv. 1983
37.993
+2.234
6.25%
1 janv. 1984
31.878
-6.115
-16.09%
1 janv. 1985
58.351
+26.472
83.04%
1 janv. 1986
69.785
+11.434
19.6%
1 janv. 1987
40.24
-29.544
-42.34%
1 janv. 1988
63.003
+22.762
56.57%
1 janv. 1989
52.999
-10.004
-15.88%
1 janv. 1990
49.834
-3.165
-5.97%
1 janv. 1991
63.672
+13.839
27.77%
1 janv. 1992
35.506
-28.167
-44.24%
1 janv. 1993
53.598
+18.093
50.96%
1 janv. 1994
50.189
-3.41
-6.36%
1 janv. 1995
74.816
+24.627
49.07%
1 janv. 1996
84.783
+9.967
13.32%
1 janv. 1997
85.53
+0.748
0.88%
1 janv. 1998
84.192
-1.339
-1.57%
1 janv. 1999
87.122
+2.93
3.48%
1 janv. 2000
86.356
-0.766
-0.88%
1 janv. 2001
87.58
+1.224
1.42%
1 janv. 2002
89.458
+1.877
2.14%
1 janv. 2003
89.106
-0.352
-0.39%
1 janv. 2004
97.352
+8.246
9.25%
1 janv. 2005
97.069
-0.283
-0.29%
1 janv. 2006
96.872
-0.196
-0.2%
1 janv. 2007
91.387
-5.486
-5.66%
1 janv. 2008
88.696
-2.69
-2.94%
1 janv. 2009
94.528
+5.831
6.57%
1 janv. 2010
95.391
+0.863
0.91%
1 janv. 2011
95.914
+0.523
0.55%
1 janv. 2012
97.787
+1.874
1.95%
1 janv. 2013
97.077
-0.711
-0.73%
1 janv. 2014
96.148
-0.928
-0.96%
Classement des pays selon les statistiques actuelles par années


Commentaires: