29
/fr/
fr
AIzaSyAYiBZKx7MnpbEhh9jyipgxe19OcubqV5w
April 1, 2024
24022
Arab World
ARB
false
2
1
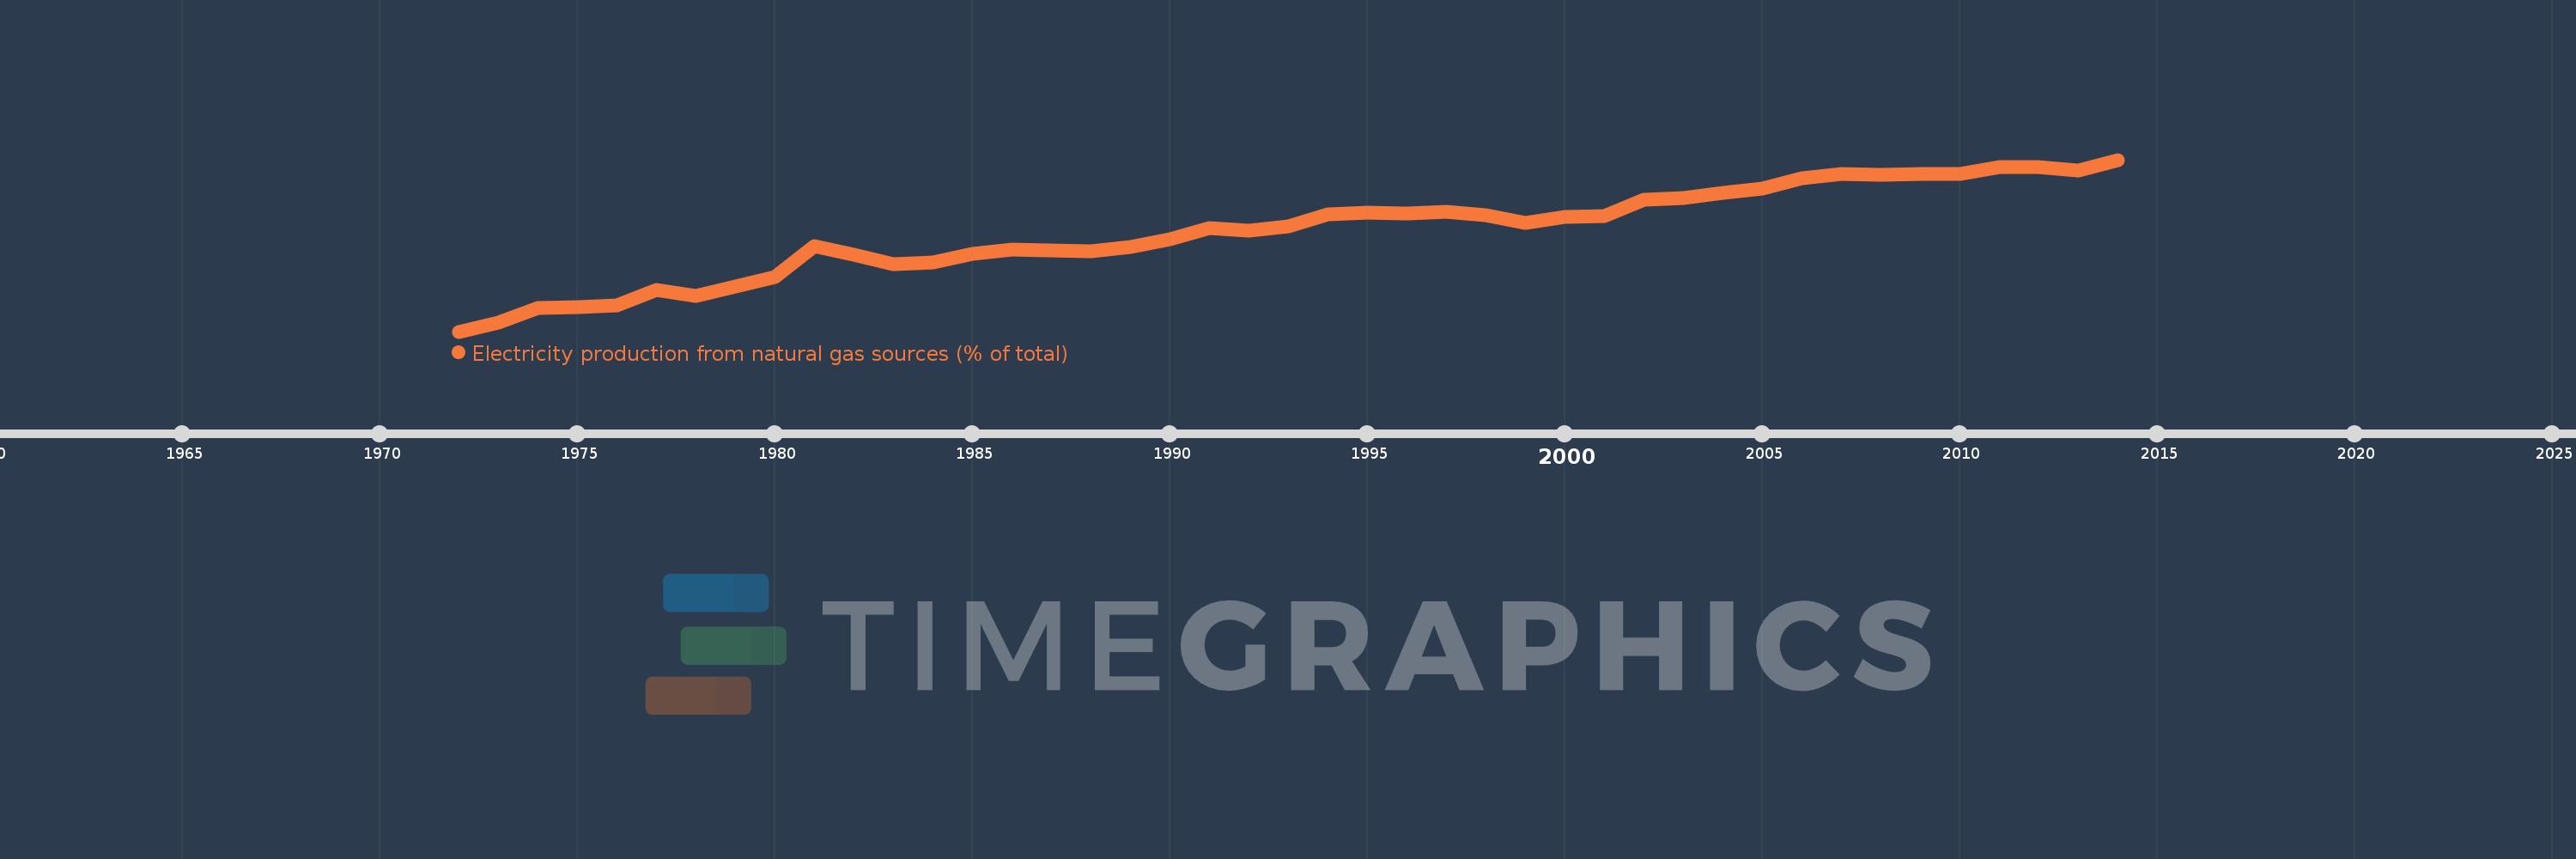
Electricity production from natural gas sources (% of total)
2014,2013,2012,2011,2010,2009,2008,2007,2006,2005,2004,2003,2002,2001,2000,1999,1998,1997,1996,1995,1994,1993,1992,1991,1990,1989,1988,1987,1986,1985,1984,1983,1982,1981,1980,1979,1978,1977,1976,1975,1974,1973,1972
Cette statistique dans les autres pays:
AlbaniaAlgeriaAngolaArab WorldArgentinaArmeniaAustraliaAustriaAzerbaijanBahrainBangladeshBelarusBelgiumBeninBoliviaBosnia and HerzegovinaBotswanaBrazilBrunei DarussalamBulgariaCambodiaCameroonCanadaCentral Europe and the BalticsChileChinaColombiaCongo, Dem. Rep.Congo, Rep.Costa RicaCote d'IvoireCroatiaCubaCuracaoCyprusCzech RepublicDenmarkDominican RepublicEarly-demographic dividendEast Asia & PacificEast Asia & Pacific (excluding high income)East Asia & Pacific (IDA & IBRD countries)EcuadorEgypt, Arab Rep.El SalvadorEritreaEstoniaEthiopiaEuro areaEurope & Central AsiaEurope & Central Asia (excluding high income)Europe & Central Asia (IDA & IBRD countries)European UnionFinlandFragile and conflict affected situationsFranceGabonGeorgiaGermanyGhanaGibraltarGreeceGuatemalaHaitiHeavily indebted poor countries (HIPC)High incomeHondurasHong Kong SAR, ChinaHungaryIBRD onlyIcelandIDA & IBRD totalIDA blendIDA onlyIDA totalIndiaIndonesiaIran, Islamic Rep.IraqIrelandIsraelItalyJamaicaJapanJordanKazakhstanKenyaKorea, Dem. People’s Rep.Korea, Rep.KosovoKuwaitKyrgyz RepublicLate-demographic dividendLatin America & Caribbean Latin America & Caribbean (excluding high income)Latin America & the Caribbean (IDA & IBRD countries)LatviaLeast developed countries: UN classificationLebanonLibyaLithuaniaLow & middle incomeLower middle incomeLuxembourgMacedonia, FYRMalaysiaMaltaMauritiusMexicoMiddle East & North AfricaMiddle East & North Africa (excluding high income)Middle East & North Africa (IDA & IBRD countries)Middle incomeMoldovaMongoliaMontenegroMoroccoMozambiqueMyanmarNamibiaNepalNetherlandsNew ZealandNicaraguaNigerNigeriaNorth AmericaNorwayOECD membersOmanOther small statesPakistanPanamaParaguayPeruPhilippinesPolandPortugalPost-demographic dividendPre-demographic dividendQatarRomaniaRussian FederationSaudi ArabiaSenegalSerbiaSingaporeSlovak RepublicSloveniaSmall statesSouth AfricaSouth AsiaSouth Asia (IDA & IBRD)South SudanSpainSri LankaSub-Saharan Africa Sub-Saharan Africa (excluding high income)Sub-Saharan Africa (IDA & IBRD countries)SudanSwedenSwitzerlandSyrian Arab RepublicTajikistanTanzaniaThailandTogoTrinidad and TobagoTunisiaTurkeyTurkmenistanUkraineUnited Arab EmiratesUnited KingdomUnited StatesUpper middle incomeUruguayUzbekistanVenezuela, RBVietnamWorldYemen, Rep.ZambiaZimbabwe La ligne de temps
Cette échelle de temps montre un graphique de 1972 année à 2014 année Arab World. Les données jusqu'à 1971 année ne sont pas présentés. Quantité d'observations actuelles selon dates: 43.
Source (désignation):
Les indicateurs du développement mondiale
Source (organisation):
IEA Statistics © OECD/IEA 2014 (http://www.iea.org/stats/index.asp), subject to https://www.iea.org/t&c/termsandconditions/
Catégories:
Energy & Mining, Climate Change, Infrastructure
Dernière mise à jour
23 avr. 2017
Les indicateurs de changement de valeurs selon les années
Minimum:
22.113
1 janv. 1972
Maximum:
65.072
1 janv. 2014
Pour la date d''observation
Valeur
Changement absolu
Le changement par rapport à la valeur précédente
1 janv. 1972
22.113
+22.113
0.0%
1 janv. 1973
24.361
+2.248
10.17%
1 janv. 1974
28.059
+3.698
15.18%
1 janv. 1975
28.257
+0.198
0.71%
1 janv. 1976
28.766
+0.508
1.8%
1 janv. 1977
32.575
+3.809
13.24%
1 janv. 1978
30.984
-1.591
-4.88%
1 janv. 1979
33.342
+2.358
7.61%
1 janv. 1980
35.82
+2.478
7.43%
1 janv. 1981
43.488
+7.668
21.41%
1 janv. 1982
41.271
-2.217
-5.1%
1 janv. 1983
38.912
-2.359
-5.72%
1 janv. 1984
39.399
+0.487
1.25%
1 janv. 1985
41.52
+2.121
5.38%
1 janv. 1986
42.635
+1.115
2.69%
1 janv. 1987
42.478
-0.157
-0.37%
1 janv. 1988
42.144
-0.334
-0.79%
1 janv. 1989
43.236
+1.091
2.59%
1 janv. 1990
45.237
+2.002
4.63%
1 janv. 1991
47.943
+2.706
5.98%
1 janv. 1992
47.319
-0.624
-1.3%
1 janv. 1993
48.401
+1.083
2.29%
1 janv. 1994
51.469
+3.068
6.34%
1 janv. 1995
51.927
+0.458
0.89%
1 janv. 1996
51.753
-0.174
-0.34%
1 janv. 1997
52.08
+0.327
0.63%
1 janv. 1998
51.222
-0.858
-1.65%
1 janv. 1999
49.201
-2.021
-3.95%
1 janv. 2000
50.744
+1.543
3.14%
1 janv. 2001
51.094
+0.35
0.69%
1 janv. 2002
55.041
+3.947
7.73%
1 janv. 2003
55.594
+0.552
1.0%
1 janv. 2004
56.803
+1.21
2.18%
1 janv. 2005
57.921
+1.118
1.97%
1 janv. 2006
60.544
+2.623
4.53%
1 janv. 2007
61.462
+0.918
1.52%
1 janv. 2008
61.249
-0.213
-0.35%
1 janv. 2009
61.454
+0.206
0.34%
1 janv. 2010
61.431
-0.023
-0.04%
1 janv. 2011
63.146
+1.715
2.79%
1 janv. 2012
63.16
+0.014
0.02%
1 janv. 2013
62.484
-0.677
-1.07%
1 janv. 2014
65.072
+2.589
4.14%
Classement des pays selon les statistiques actuelles par années


Commentaires: