29
/fr/
fr
AIzaSyAYiBZKx7MnpbEhh9jyipgxe19OcubqV5w
April 1, 2024
26752
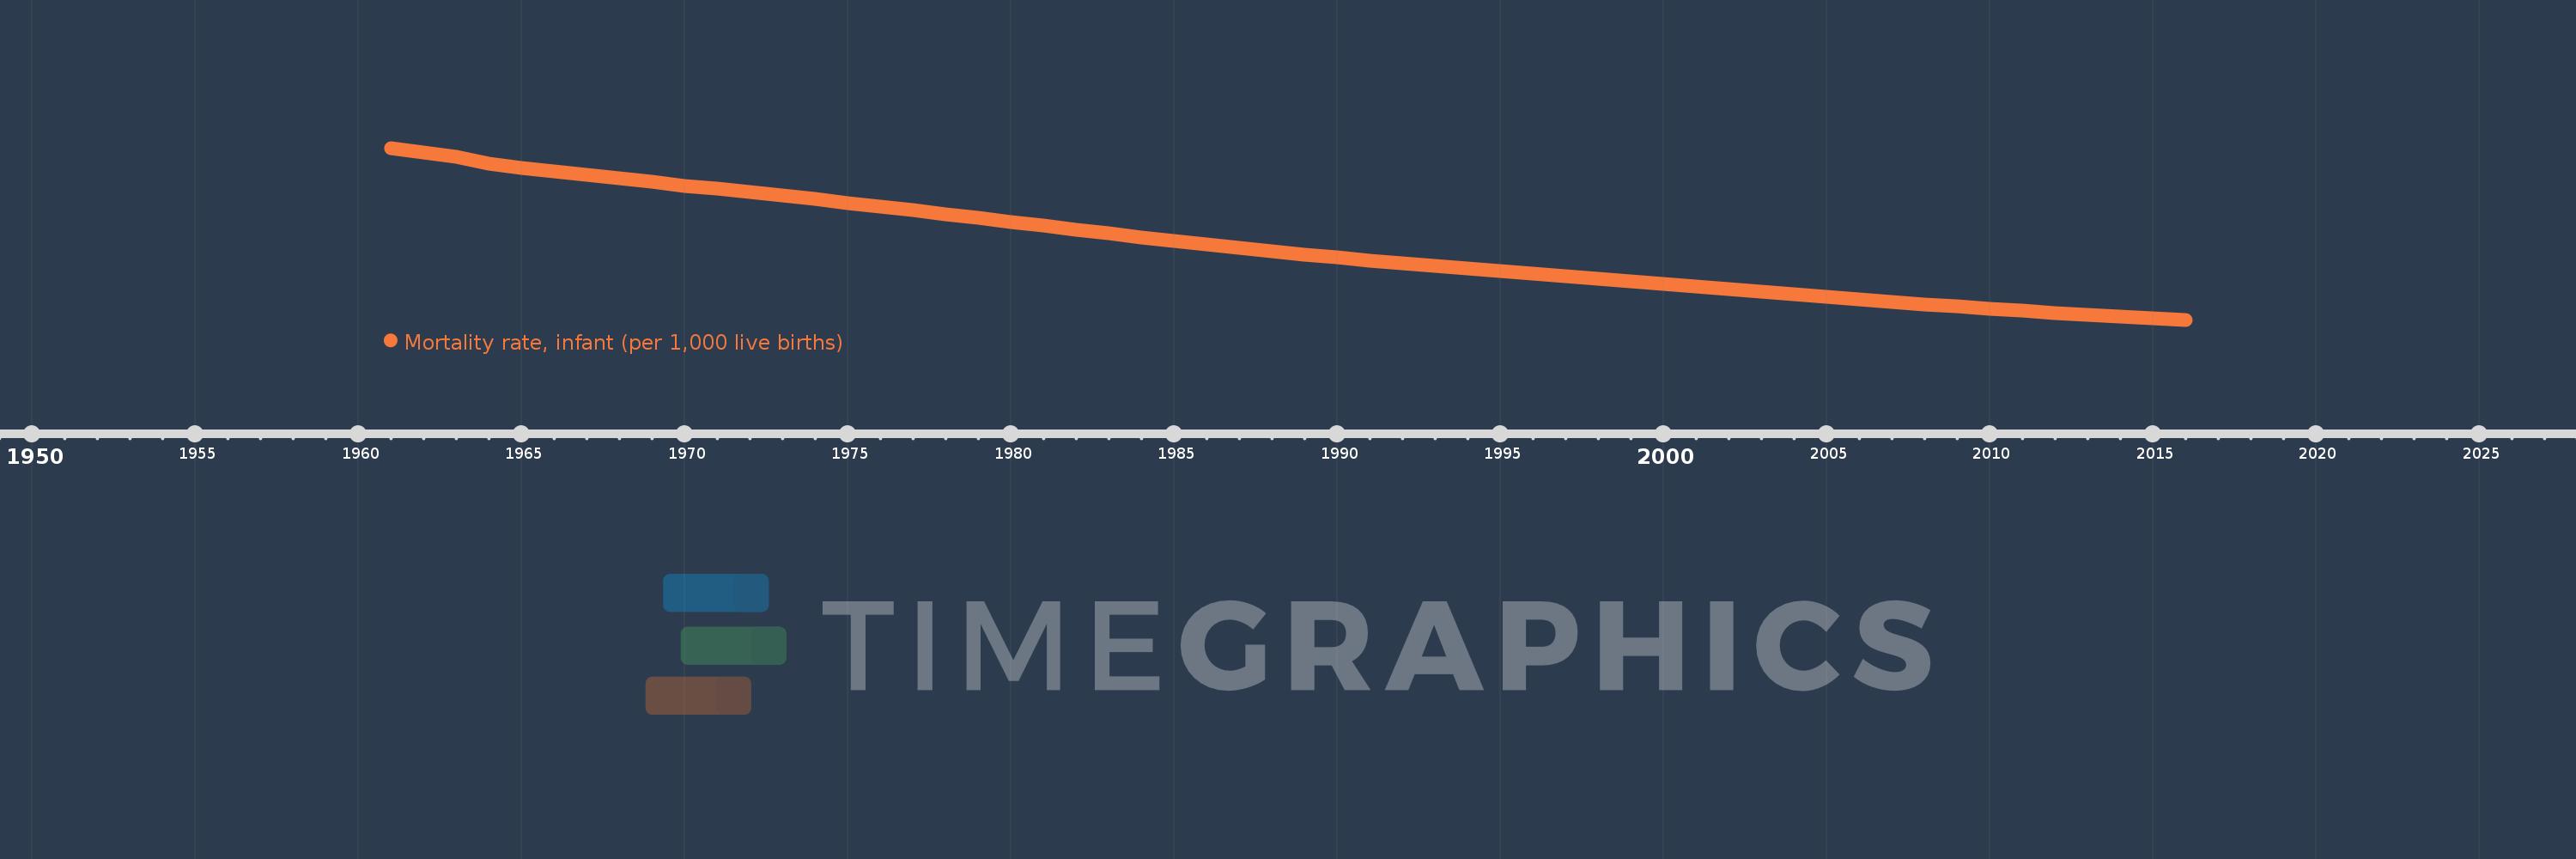
Early-demographic dividend
EAR
false
2
1
Mortality rate, infant (per 1,000 live births)
2016,2015,2014,2013,2012,2011,2010,2009,2008,2007,2006,2005,2004,2003,2002,2001,2000,1999,1998,1997,1996,1995,1994,1993,1992,1991,1990,1989,1988,1987,1986,1985,1984,1983,1982,1981,1980,1979,1978,1977,1976,1975,1974,1973,1972,1971,1970,1969,1968,1967,1966,1965,1964,1963,1962,1961
Cette statistique dans les autres pays:
AfghanistanAlbaniaAlgeriaAndorraAngolaAntigua and BarbudaArab WorldArgentinaArmeniaAustraliaAustriaAzerbaijanBahamas, TheBahrainBangladeshBarbadosBelarusBelgiumBelizeBeninBhutanBoliviaBosnia and HerzegovinaBotswanaBrazilBrunei DarussalamBulgariaBurkina FasoBurundiCabo VerdeCambodiaCameroonCanadaCaribbean small statesCentral African RepublicCentral Europe and the BalticsChadChileChinaColombiaComorosCongo, Dem. Rep.Congo, Rep.Costa RicaCote d'IvoireCroatiaCubaCyprusCzech RepublicDenmarkDjiboutiDominicaDominican RepublicEarly-demographic dividendEast Asia & PacificEast Asia & Pacific (excluding high income)East Asia & Pacific (IDA & IBRD countries)EcuadorEgypt, Arab Rep.El SalvadorEquatorial GuineaEritreaEstoniaEthiopiaEuro areaEurope & Central AsiaEurope & Central Asia (excluding high income)Europe & Central Asia (IDA & IBRD countries)European UnionFijiFinlandFragile and conflict affected situationsFranceGabonGambia, TheGeorgiaGermanyGhanaGreeceGrenadaGuatemalaGuineaGuinea-BissauGuyanaHaitiHeavily indebted poor countries (HIPC)High incomeHondurasHungaryIBRD onlyIcelandIDA & IBRD totalIDA blendIDA onlyIDA totalIndiaIndonesiaIran, Islamic Rep.IraqIrelandIsraelItalyJamaicaJapanJordanKazakhstanKenyaKiribatiKorea, Dem. People’s Rep.Korea, Rep.KuwaitKyrgyz RepublicLao PDRLate-demographic dividendLatin America & Caribbean Latin America & Caribbean (excluding high income)Latin America & the Caribbean (IDA & IBRD countries)LatviaLeast developed countries: UN classificationLebanonLesothoLiberiaLibyaLithuaniaLow & middle incomeLow incomeLower middle incomeLuxembourgMacedonia, FYRMadagascarMalawiMalaysiaMaldivesMaliMaltaMarshall IslandsMauritaniaMauritiusMexicoMicronesia, Fed. Sts.Middle East & North AfricaMiddle East & North Africa (excluding high income)Middle East & North Africa (IDA & IBRD countries)Middle incomeMoldovaMonacoMongoliaMontenegroMoroccoMozambiqueMyanmarNamibiaNauruNepalNetherlandsNew ZealandNicaraguaNigerNigeriaNorth AmericaNorwayOECD membersOmanOther small statesPacific island small statesPakistanPalauPanamaPapua New GuineaParaguayPeruPhilippinesPolandPortugalPost-demographic dividendPre-demographic dividendQatarRomaniaRussian FederationRwandaSamoaSan MarinoSao Tome and PrincipeSaudi ArabiaSenegalSerbiaSeychellesSierra LeoneSingaporeSlovak RepublicSloveniaSmall statesSolomon IslandsSomaliaSouth AfricaSouth AsiaSouth Asia (IDA & IBRD)South SudanSpainSri LankaSt. Kitts and NevisSt. LuciaSt. Vincent and the GrenadinesSub-Saharan Africa Sub-Saharan Africa (excluding high income)Sub-Saharan Africa (IDA & IBRD countries)SudanSurinameSwazilandSwedenSwitzerlandSyrian Arab RepublicTajikistanTanzaniaThailandTimor-LesteTogoTongaTrinidad and TobagoTunisiaTurkeyTurkmenistanTuvaluUgandaUkraineUnited Arab EmiratesUnited KingdomUnited StatesUpper middle incomeUruguayUzbekistanVanuatuVenezuela, RBVietnamWest Bank and GazaWorldYemen, Rep.ZambiaZimbabwe La ligne de temps
Cette échelle de temps montre un graphique de 1961 année à 2016 année Early-demographic dividend. Les données jusqu'à 1960 année ne sont pas présentés. Quantité d'observations actuelles selon dates: 56.
Source (désignation):
Les indicateurs du développement mondiale
Source (organisation):
Estimates Developed by the UN Inter-agency Group for Child Mortality Estimation (UNICEF, WHO, World Bank, UN DESA Population Division) at www.childmortality.org. Projected data are from the United Nations Population Division's World Population Prospects; and may in some cases not be consistent with data before the current year.
Catégories:
Health
Dernière mise à jour
23 avr. 2017
Les indicateurs de changement de valeurs selon les années
Minimum:
33.554
1 janv. 2016
Maximum:
160.307
1 janv. 1961
Pour la date d''observation
Valeur
Changement absolu
Le changement par rapport à la valeur précédente
1 janv. 1961
160.307
+160.307
0.0%
1 janv. 1962
156.957
-3.35
-2.09%
1 janv. 1963
153.793
-3.163
-2.02%
1 janv. 1964
148.708
-5.085
-3.31%
1 janv. 1965
145.801
-2.907
-1.96%
1 janv. 1966
143.095
-2.705
-1.86%
1 janv. 1967
140.508
-2.587
-1.81%
1 janv. 1968
137.977
-2.531
-1.8%
1 janv. 1969
135.421
-2.556
-1.85%
1 janv. 1970
132.28
-3.141
-2.32%
1 janv. 1971
130.083
-2.198
-1.66%
1 janv. 1972
127.792
-2.291
-1.76%
1 janv. 1973
125.314
-2.478
-1.94%
1 janv. 1974
122.856
-2.458
-1.96%
1 janv. 1975
119.634
-3.221
-2.62%
1 janv. 1976
117.316
-2.319
-1.94%
1 janv. 1977
114.512
-2.804
-2.39%
1 janv. 1978
111.628
-2.883
-2.52%
1 janv. 1979
108.76
-2.868
-2.57%
1 janv. 1980
105.778
-2.982
-2.74%
1 janv. 1981
102.815
-2.963
-2.8%
1 janv. 1982
99.927
-2.887
-2.81%
1 janv. 1983
97.092
-2.835
-2.84%
1 janv. 1984
94.33
-2.763
-2.85%
1 janv. 1985
91.655
-2.675
-2.84%
1 janv. 1986
89.089
-2.566
-2.8%
1 janv. 1987
86.583
-2.506
-2.81%
1 janv. 1988
84.149
-2.434
-2.81%
1 janv. 1989
81.797
-2.352
-2.79%
1 janv. 1990
79.56
-2.237
-2.73%
1 janv. 1991
77.407
-2.154
-2.71%
1 janv. 1992
75.389
-2.017
-2.61%
1 janv. 1993
73.428
-1.961
-2.6%
1 janv. 1994
71.503
-1.925
-2.62%
1 janv. 1995
69.7
-1.803
-2.52%
1 janv. 1996
67.795
-1.905
-2.73%
1 janv. 1997
65.866
-1.93
-2.85%
1 janv. 1998
63.904
-1.962
-2.98%
1 janv. 1999
61.979
-1.925
-3.01%
1 janv. 2000
59.976
-2.003
-3.23%
1 janv. 2001
58.007
-1.969
-3.28%
1 janv. 2002
56.051
-1.956
-3.37%
1 janv. 2003
54.09
-1.961
-3.5%
1 janv. 2004
52.184
-1.906
-3.52%
1 janv. 2005
50.386
-1.799
-3.45%
1 janv. 2006
48.477
-1.909
-3.79%
1 janv. 2007
46.756
-1.721
-3.55%
1 janv. 2008
45.024
-1.733
-3.71%
1 janv. 2009
43.439
-1.585
-3.52%
1 janv. 2010
41.714
-1.725
-3.97%
1 janv. 2011
40.237
-1.476
-3.54%
1 janv. 2012
38.616
-1.622
-4.03%
1 janv. 2013
37.192
-1.424
-3.69%
1 janv. 2014
35.877
-1.315
-3.54%
1 janv. 2015
34.658
-1.219
-3.4%
1 janv. 2016
33.554
-1.104
-3.19%
Classement des pays selon les statistiques actuelles par années


Commentaires: