29
/fr/
fr
AIzaSyAYiBZKx7MnpbEhh9jyipgxe19OcubqV5w
April 1, 2024
231354
Rwanda
RWA
true
2
1
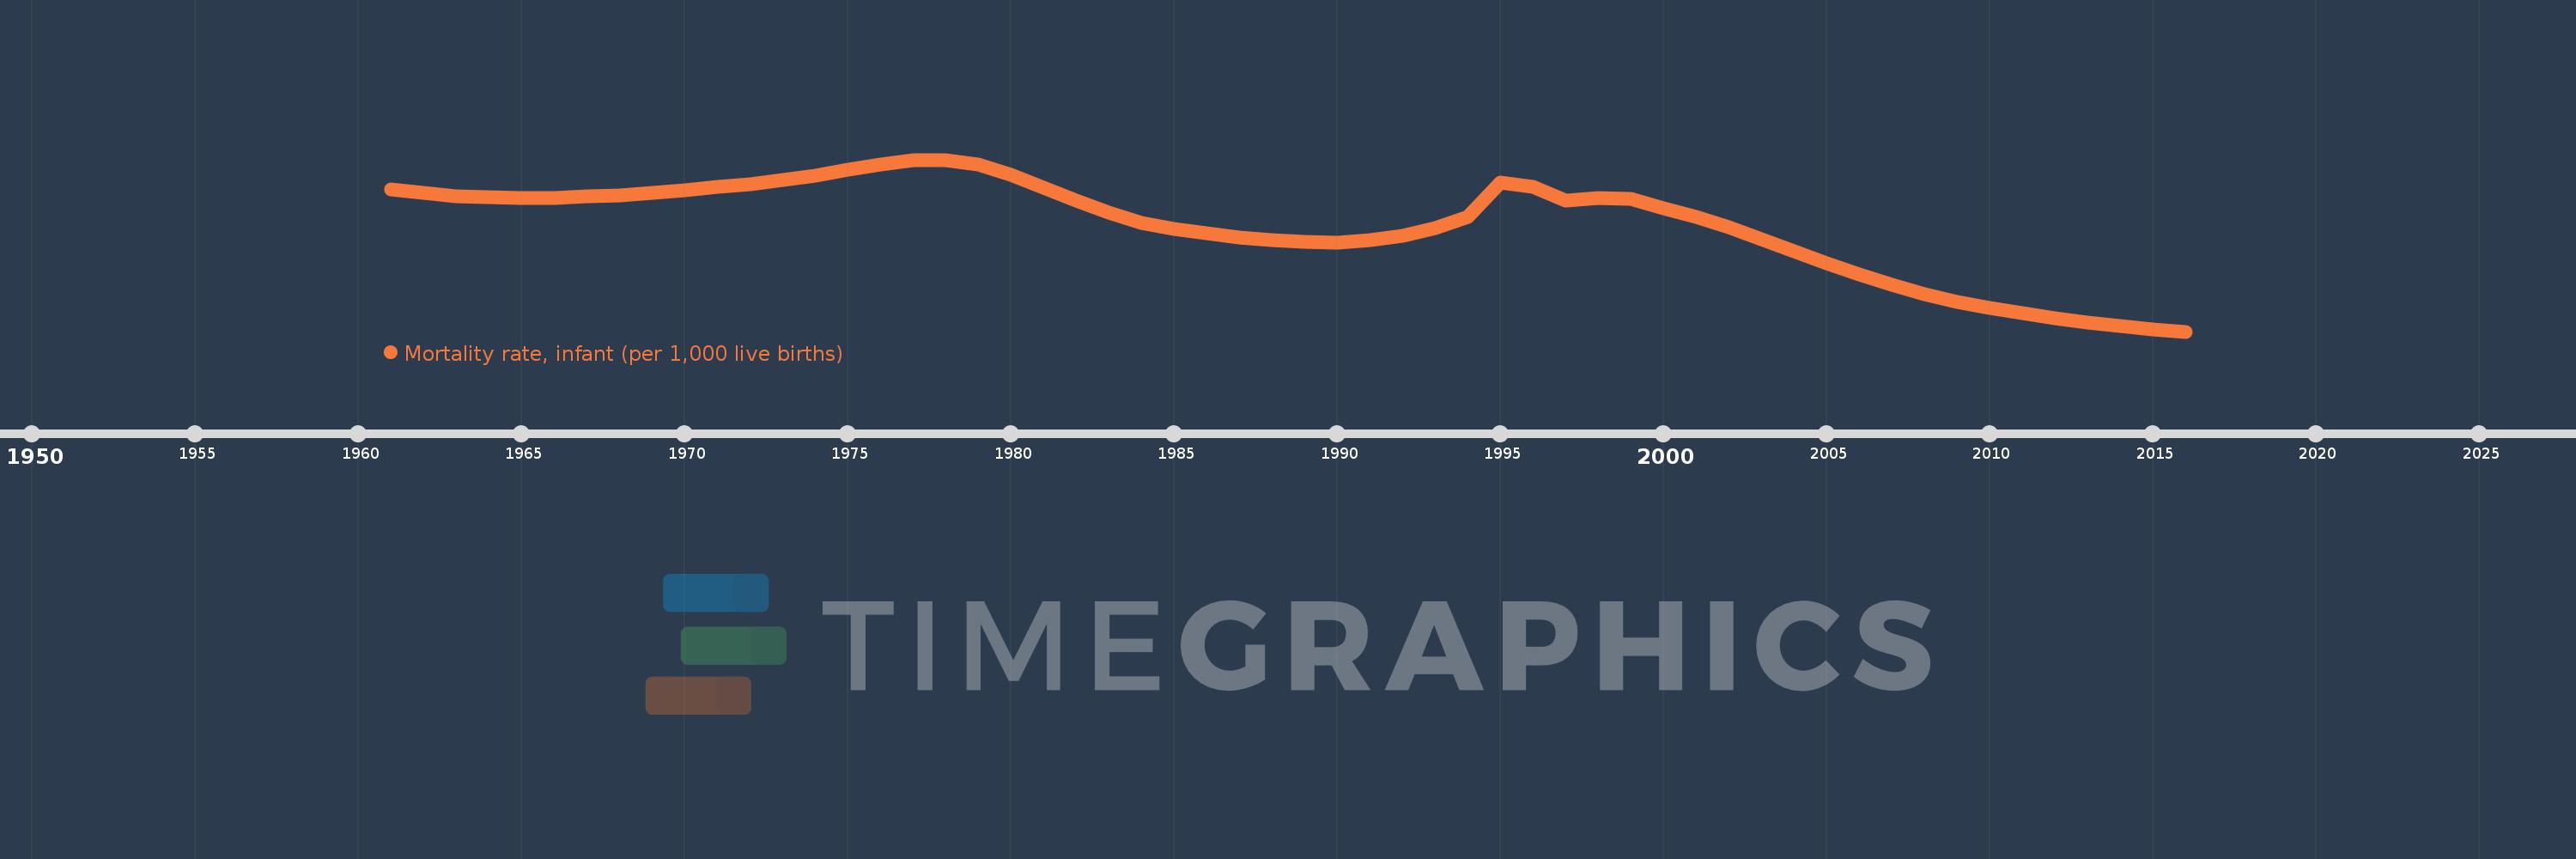
Mortality rate, infant (per 1,000 live births)
2016,2015,2014,2013,2012,2011,2010,2009,2008,2007,2006,2005,2004,2003,2002,2001,2000,1999,1998,1997,1996,1995,1994,1993,1992,1991,1990,1989,1988,1987,1986,1985,1984,1983,1982,1981,1980,1979,1978,1977,1976,1975,1974,1973,1972,1971,1970,1969,1968,1967,1966,1965,1964,1963,1962,1961
Cette statistique dans les autres pays:
AfghanistanAlbaniaAlgeriaAndorraAngolaAntigua and BarbudaArab WorldArgentinaArmeniaAustraliaAustriaAzerbaijanBahamas, TheBahrainBangladeshBarbadosBelarusBelgiumBelizeBeninBhutanBoliviaBosnia and HerzegovinaBotswanaBrazilBrunei DarussalamBulgariaBurkina FasoBurundiCabo VerdeCambodiaCameroonCanadaCaribbean small statesCentral African RepublicCentral Europe and the BalticsChadChileChinaColombiaComorosCongo, Dem. Rep.Congo, Rep.Costa RicaCote d'IvoireCroatiaCubaCyprusCzech RepublicDenmarkDjiboutiDominicaDominican RepublicEarly-demographic dividendEast Asia & PacificEast Asia & Pacific (excluding high income)East Asia & Pacific (IDA & IBRD countries)EcuadorEgypt, Arab Rep.El SalvadorEquatorial GuineaEritreaEstoniaEthiopiaEuro areaEurope & Central AsiaEurope & Central Asia (excluding high income)Europe & Central Asia (IDA & IBRD countries)European UnionFijiFinlandFragile and conflict affected situationsFranceGabonGambia, TheGeorgiaGermanyGhanaGreeceGrenadaGuatemalaGuineaGuinea-BissauGuyanaHaitiHeavily indebted poor countries (HIPC)High incomeHondurasHungaryIBRD onlyIcelandIDA & IBRD totalIDA blendIDA onlyIDA totalIndiaIndonesiaIran, Islamic Rep.IraqIrelandIsraelItalyJamaicaJapanJordanKazakhstanKenyaKiribatiKorea, Dem. People’s Rep.Korea, Rep.KuwaitKyrgyz RepublicLao PDRLate-demographic dividendLatin America & Caribbean Latin America & Caribbean (excluding high income)Latin America & the Caribbean (IDA & IBRD countries)LatviaLeast developed countries: UN classificationLebanonLesothoLiberiaLibyaLithuaniaLow & middle incomeLow incomeLower middle incomeLuxembourgMacedonia, FYRMadagascarMalawiMalaysiaMaldivesMaliMaltaMarshall IslandsMauritaniaMauritiusMexicoMicronesia, Fed. Sts.Middle East & North AfricaMiddle East & North Africa (excluding high income)Middle East & North Africa (IDA & IBRD countries)Middle incomeMoldovaMonacoMongoliaMontenegroMoroccoMozambiqueMyanmarNamibiaNauruNepalNetherlandsNew ZealandNicaraguaNigerNigeriaNorth AmericaNorwayOECD membersOmanOther small statesPacific island small statesPakistanPalauPanamaPapua New GuineaParaguayPeruPhilippinesPolandPortugalPost-demographic dividendPre-demographic dividendQatarRomaniaRussian FederationRwandaSamoaSan MarinoSao Tome and PrincipeSaudi ArabiaSenegalSerbiaSeychellesSierra LeoneSingaporeSlovak RepublicSloveniaSmall statesSolomon IslandsSomaliaSouth AfricaSouth AsiaSouth Asia (IDA & IBRD)South SudanSpainSri LankaSt. Kitts and NevisSt. LuciaSt. Vincent and the GrenadinesSub-Saharan Africa Sub-Saharan Africa (excluding high income)Sub-Saharan Africa (IDA & IBRD countries)SudanSurinameSwazilandSwedenSwitzerlandSyrian Arab RepublicTajikistanTanzaniaThailandTimor-LesteTogoTongaTrinidad and TobagoTunisiaTurkeyTurkmenistanTuvaluUgandaUkraineUnited Arab EmiratesUnited KingdomUnited StatesUpper middle incomeUruguayUzbekistanVanuatuVenezuela, RBVietnamWest Bank and GazaWorldYemen, Rep.ZambiaZimbabwe La ligne de temps
Cette échelle de temps montre un graphique de 1961 année à 2016 année Rwanda. Les données jusqu'à 1960 année ne sont pas présentés. Quantité d'observations actuelles selon dates: 56.
Source (désignation):
Les indicateurs du développement mondiale
Source (organisation):
Estimates Developed by the UN Inter-agency Group for Child Mortality Estimation (UNICEF, WHO, World Bank, UN DESA Population Division) at www.childmortality.org. Projected data are from the United Nations Population Division's World Population Prospects; and may in some cases not be consistent with data before the current year.
Catégories:
Health
Dernière mise à jour
23 avr. 2017
Les indicateurs de changement de valeurs selon les années
Maximum:
148.0
1 janv. 1978
Pour la date d''observation
Valeur
Changement absolu
Le changement par rapport à la valeur précédente
1 janv. 1961
127.9
+127.9
0.0%
1 janv. 1962
125.3
-2.6
-2.03%
1 janv. 1963
123.4
-1.9
-1.52%
1 janv. 1964
122.4
-1.0
-0.81%
1 janv. 1965
122.0
-0.4
-0.33%
1 janv. 1966
122.2
+0.2
0.16%
1 janv. 1967
123.0
+0.8
0.65%
1 janv. 1968
124.0
+1.0
0.81%
1 janv. 1969
125.5
+1.5
1.21%
1 janv. 1970
127.3
+1.8
1.43%
1 janv. 1971
129.4
+2.1
1.65%
1 janv. 1972
131.5
+2.1
1.62%
1 janv. 1973
134.1
+2.6
1.98%
1 janv. 1974
137.3
+3.2
2.39%
1 janv. 1975
141.1
+3.8
2.77%
1 janv. 1976
144.8
+3.7
2.62%
1 janv. 1977
147.5
+2.7
1.86%
1 janv. 1978
148.0
+0.5
0.34%
1 janv. 1979
144.9
-3.1
-2.09%
1 janv. 1980
138.0
-6.9
-4.76%
1 janv. 1981
129.1
-8.9
-6.45%
1 janv. 1982
120.0
-9.1
-7.05%
1 janv. 1983
111.8
-8.2
-6.83%
1 janv. 1984
105.3
-6.5
-5.81%
1 janv. 1985
100.9
-4.4
-4.18%
1 janv. 1986
97.8
-3.1
-3.07%
1 janv. 1987
95.1
-2.7
-2.76%
1 janv. 1988
93.1
-2.0
-2.1%
1 janv. 1989
91.9
-1.2
-1.29%
1 janv. 1990
91.8
-0.1
-0.11%
1 janv. 1991
93.2
+1.4
1.53%
1 janv. 1992
96.3
+3.1
3.33%
1 janv. 1993
101.3
+5.0
5.19%
1 janv. 1994
109.0
+7.7
7.6%
1 janv. 1995
132.3
+23.3
21.38%
1 janv. 1996
129.6
-2.7
-2.04%
1 janv. 1997
120.3
-9.3
-7.18%
1 janv. 1998
121.7
+1.4
1.16%
1 janv. 1999
121.4
-0.3
-0.25%
1 janv. 2000
115.2
-6.2
-5.11%
1 janv. 2001
109.2
-6.0
-5.21%
1 janv. 2002
102.3
-6.9
-6.32%
1 janv. 2003
94.1
-8.2
-8.02%
1 janv. 2004
86.0
-8.1
-8.61%
1 janv. 2005
77.7
-8.3
-9.65%
1 janv. 2006
70.2
-7.5
-9.65%
1 janv. 2007
63.1
-7.1
-10.11%
1 janv. 2008
56.8
-6.3
-9.98%
1 janv. 2009
51.5
-5.3
-9.33%
1 janv. 2010
47.3
-4.2
-8.16%
1 janv. 2011
43.8
-3.5
-7.4%
1 janv. 2012
40.0
-3.8
-8.68%
1 janv. 2013
37.1
-2.9
-7.25%
1 janv. 2014
34.7
-2.4
-6.47%
1 janv. 2015
32.7
-2.0
-5.76%
1 janv. 2016
31.1
-1.6
-4.89%
Classement des pays selon les statistiques actuelles par années


Commentaires: