29
/fr/
fr
AIzaSyAYiBZKx7MnpbEhh9jyipgxe19OcubqV5w
April 1, 2024
266882
Trinidad and Tobago
TTO
true
2
1
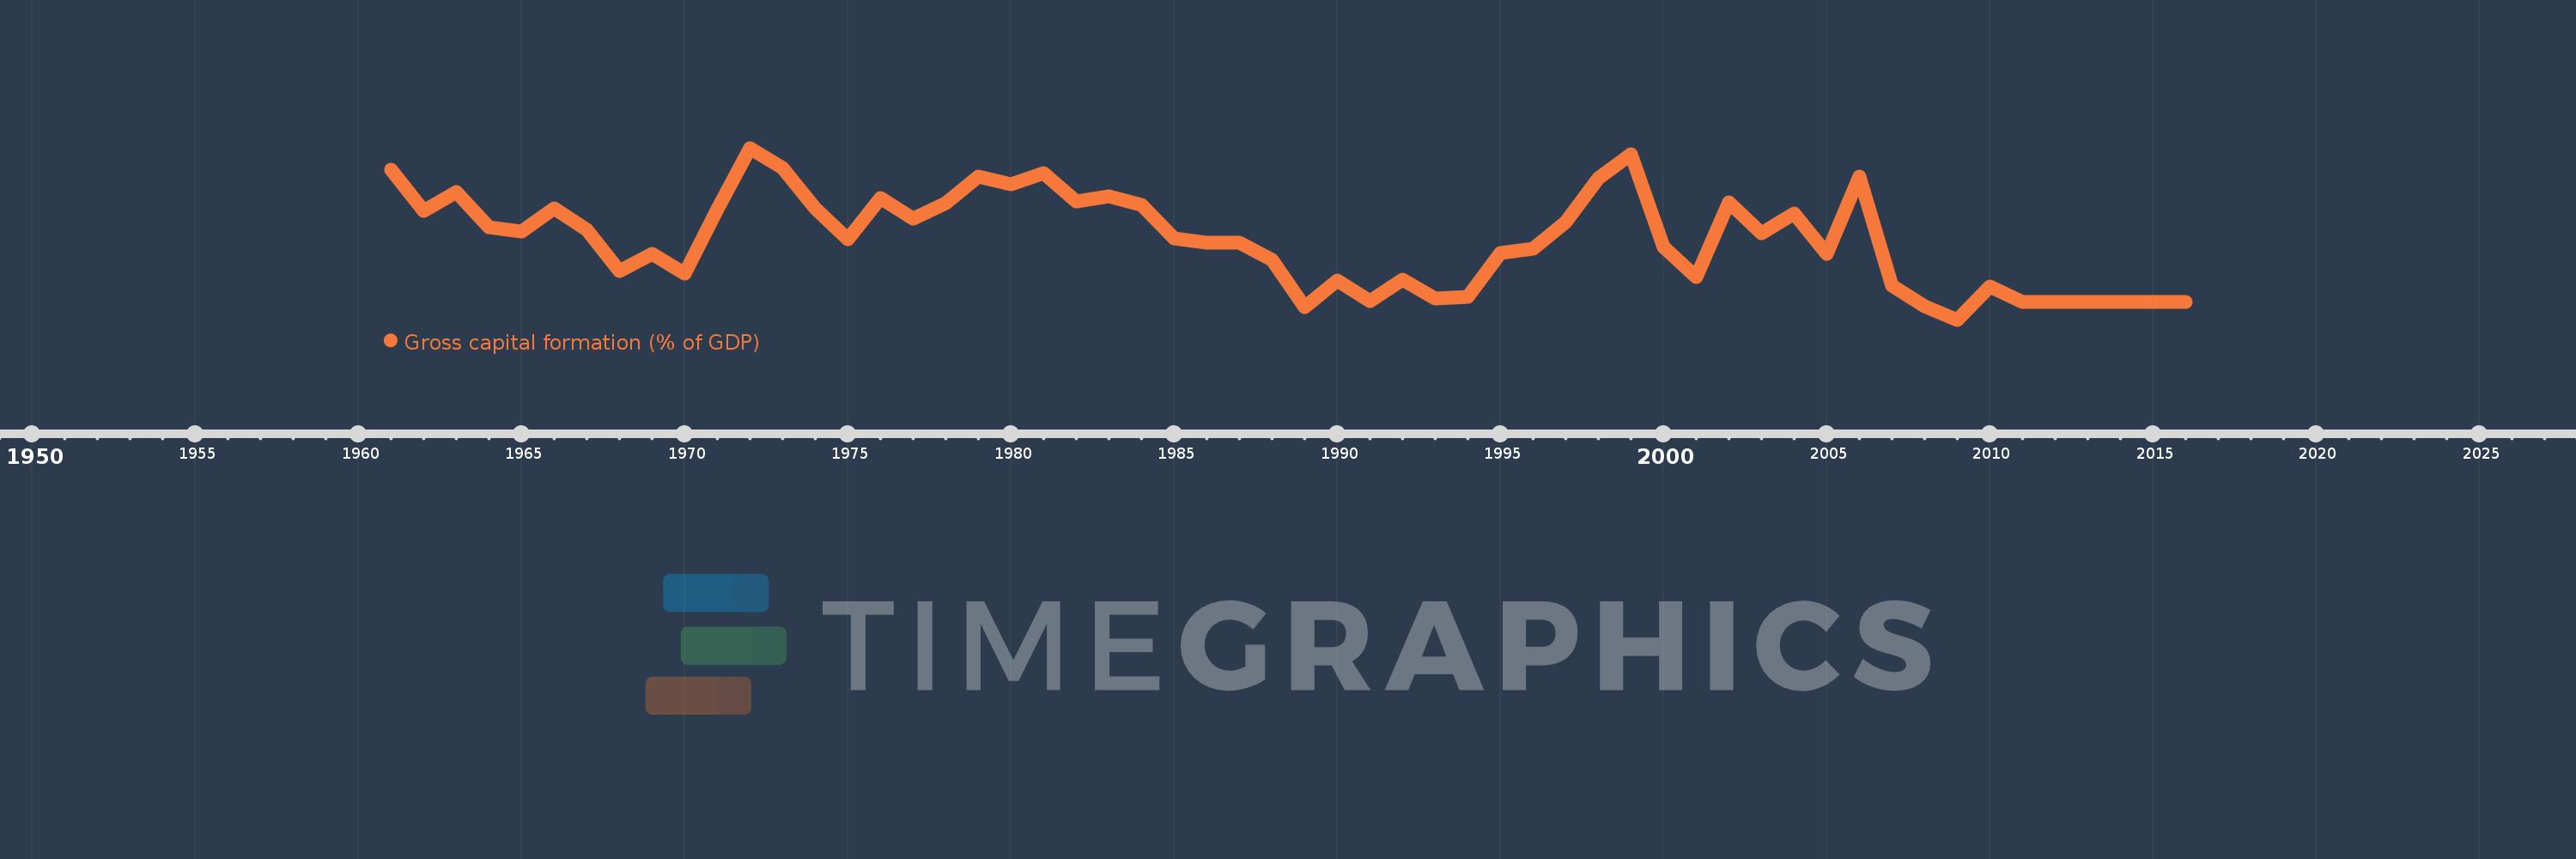
Gross capital formation (% of GDP)
2016,2015,2014,2013,2012,2011,2010,2009,2008,2007,2006,2005,2004,2003,2002,2001,2000,1999,1998,1997,1996,1995,1994,1993,1992,1991,1990,1989,1988,1987,1986,1985,1984,1983,1982,1981,1980,1979,1978,1977,1976,1975,1974,1973,1972,1971,1970,1969,1968,1967,1966,1965,1964,1963,1962,1961
Cette statistique dans les autres pays:
AfghanistanAlbaniaAlgeriaAngolaAntigua and BarbudaArab WorldArgentinaArmeniaArubaAustraliaAustriaAzerbaijanBahamas, TheBahrainBangladeshBarbadosBelarusBelgiumBelizeBeninBermudaBhutanBoliviaBosnia and HerzegovinaBotswanaBrazilBrunei DarussalamBulgariaBurkina FasoBurundiCabo VerdeCambodiaCameroonCanadaCaribbean small statesCentral African RepublicCentral Europe and the BalticsChadChileChinaColombiaComorosCongo, Dem. Rep.Congo, Rep.Costa RicaCote d'IvoireCroatiaCubaCyprusCzech RepublicDenmarkDjiboutiDominicaDominican RepublicEarly-demographic dividendEast Asia & PacificEast Asia & Pacific (excluding high income)East Asia & Pacific (IDA & IBRD countries)EcuadorEgypt, Arab Rep.El SalvadorEquatorial GuineaEritreaEstoniaEthiopiaEuro areaEurope & Central AsiaEurope & Central Asia (excluding high income)Europe & Central Asia (IDA & IBRD countries)European UnionFaroe IslandsFijiFinlandFragile and conflict affected situationsFranceGabonGambia, TheGeorgiaGermanyGhanaGreeceGrenadaGuatemalaGuineaGuinea-BissauGuyanaHaitiHeavily indebted poor countries (HIPC)High incomeHondurasHong Kong SAR, ChinaHungaryIBRD onlyIcelandIDA & IBRD totalIDA blendIDA onlyIDA totalIndiaIndonesiaIran, Islamic Rep.IraqIrelandIsraelItalyJamaicaJapanJordanKazakhstanKenyaKiribatiKorea, Rep.KosovoKuwaitKyrgyz RepublicLao PDRLate-demographic dividendLatin America & Caribbean Latin America & Caribbean (excluding high income)Latin America & the Caribbean (IDA & IBRD countries)LatviaLeast developed countries: UN classificationLebanonLesothoLiberiaLibyaLithuaniaLow & middle incomeLow incomeLower middle incomeLuxembourgMacao SAR, ChinaMacedonia, FYRMadagascarMalawiMalaysiaMaldivesMaliMaltaMauritaniaMauritiusMexicoMicronesia, Fed. Sts.Middle East & North AfricaMiddle East & North Africa (excluding high income)Middle East & North Africa (IDA & IBRD countries)Middle incomeMoldovaMongoliaMontenegroMoroccoMozambiqueNamibiaNepalNetherlandsNew CaledoniaNew ZealandNicaraguaNigerNigeriaNorth AmericaNorwayOECD membersOmanOther small statesPacific island small statesPakistanPanamaPapua New GuineaParaguayPeruPhilippinesPolandPortugalPost-demographic dividendPre-demographic dividendPuerto RicoQatarRomaniaRussian FederationRwandaSaudi ArabiaSenegalSerbiaSeychellesSierra LeoneSingaporeSlovak RepublicSloveniaSmall statesSolomon IslandsSomaliaSouth AfricaSouth AsiaSouth Asia (IDA & IBRD)South SudanSpainSri LankaSt. Kitts and NevisSt. LuciaSt. Vincent and the GrenadinesSub-Saharan Africa Sub-Saharan Africa (excluding high income)Sub-Saharan Africa (IDA & IBRD countries)SudanSurinameSwazilandSwedenSwitzerlandSyrian Arab RepublicTajikistanTanzaniaThailandTimor-LesteTogoTongaTrinidad and TobagoTunisiaTurkeyTurkmenistanUgandaUkraineUnited Arab EmiratesUnited KingdomUnited StatesUpper middle incomeUruguayUzbekistanVanuatuVenezuela, RBVietnamWest Bank and GazaWorldYemen, Rep.ZambiaZimbabwe La ligne de temps
Cette échelle de temps montre un graphique de 1961 année à 2016 année Trinidad and Tobago. Les données jusqu'à 1960 année ne sont pas présentés. Quantité d'observations actuelles selon dates: 56.
Source (désignation):
Les indicateurs du développement mondiale
Source (organisation):
World Bank national accounts data, and OECD National Accounts data files.
Catégories:
Economy & Growth
Dernière mise à jour
23 avr. 2017
Les indicateurs de changement de valeurs selon les années
Minimum:
11.078
1 janv. 2009
Maximum:
33.981
1 janv. 1972
Pour la date d''observation
Valeur
Changement absolu
Le changement par rapport à la valeur précédente
1 janv. 1961
31.134
+31.134
0.0%
1 janv. 1962
25.558
-5.575
-17.91%
1 janv. 1963
28.087
+2.529
9.89%
1 janv. 1964
23.368
-4.719
-16.8%
1 janv. 1965
22.845
-0.523
-2.24%
1 janv. 1966
25.929
+3.084
13.5%
1 janv. 1967
23.06
-2.869
-11.07%
1 janv. 1968
17.608
-5.452
-23.64%
1 janv. 1969
19.805
+2.197
12.48%
1 janv. 1970
17.184
-2.621
-13.23%
1 janv. 1971
25.856
+8.672
50.46%
1 janv. 1972
33.981
+8.125
31.42%
1 janv. 1973
31.319
-2.662
-7.83%
1 janv. 1974
25.954
-5.365
-17.13%
1 janv. 1975
21.828
-4.125
-15.89%
1 janv. 1976
27.345
+5.516
25.27%
1 janv. 1977
24.555
-2.79
-10.2%
1 janv. 1978
26.65
+2.095
8.53%
1 janv. 1979
30.219
+3.569
13.39%
1 janv. 1980
29.092
-1.127
-3.73%
1 janv. 1981
30.603
+1.511
5.19%
1 janv. 1982
26.858
-3.745
-12.24%
1 janv. 1983
27.497
+0.639
2.38%
1 janv. 1984
26.421
-1.076
-3.91%
1 janv. 1985
21.894
-4.527
-17.13%
1 janv. 1986
21.305
-0.589
-2.69%
1 janv. 1987
21.362
+0.057
0.27%
1 janv. 1988
19.094
-2.267
-10.61%
1 janv. 1989
12.809
-6.286
-32.92%
1 janv. 1990
16.345
+3.536
27.6%
1 janv. 1991
13.599
-2.746
-16.8%
1 janv. 1992
16.411
+2.813
20.68%
1 janv. 1993
13.879
-2.532
-15.43%
1 janv. 1994
14.107
+0.228
1.64%
1 janv. 1995
20.0
+5.893
41.78%
1 janv. 1996
20.581
+0.581
2.91%
1 janv. 1997
24.084
+3.503
17.02%
1 janv. 1998
29.886
+5.802
24.09%
1 janv. 1999
33.163
+3.277
10.97%
1 janv. 2000
20.773
-12.39
-37.36%
1 janv. 2001
16.786
-3.987
-19.19%
1 janv. 2002
26.713
+9.927
59.14%
1 janv. 2003
22.626
-4.087
-15.3%
1 janv. 2004
25.188
+2.562
11.32%
1 janv. 2005
19.863
-5.325
-21.14%
1 janv. 2006
30.176
+10.313
51.92%
1 janv. 2007
15.65
-14.526
-48.14%
1 janv. 2008
12.899
-2.75
-17.57%
1 janv. 2009
11.078
-1.822
-14.12%
1 janv. 2010
15.465
+4.387
39.6%
1 janv. 2011
13.402
-2.063
-13.34%
1 janv. 2012
13.423
+0.021
0.16%
1 janv. 2013
13.423
0.0
0.0%
1 janv. 2014
13.423
0.0
0.0%
1 janv. 2015
13.423
0.0
0.0%
1 janv. 2016
13.423
0.0
0.0%
Classement des pays selon les statistiques actuelles par années


Commentaires: