29
/fr/
fr
AIzaSyAYiBZKx7MnpbEhh9jyipgxe19OcubqV5w
April 1, 2024
265805
Tonga
TON
true
2
1
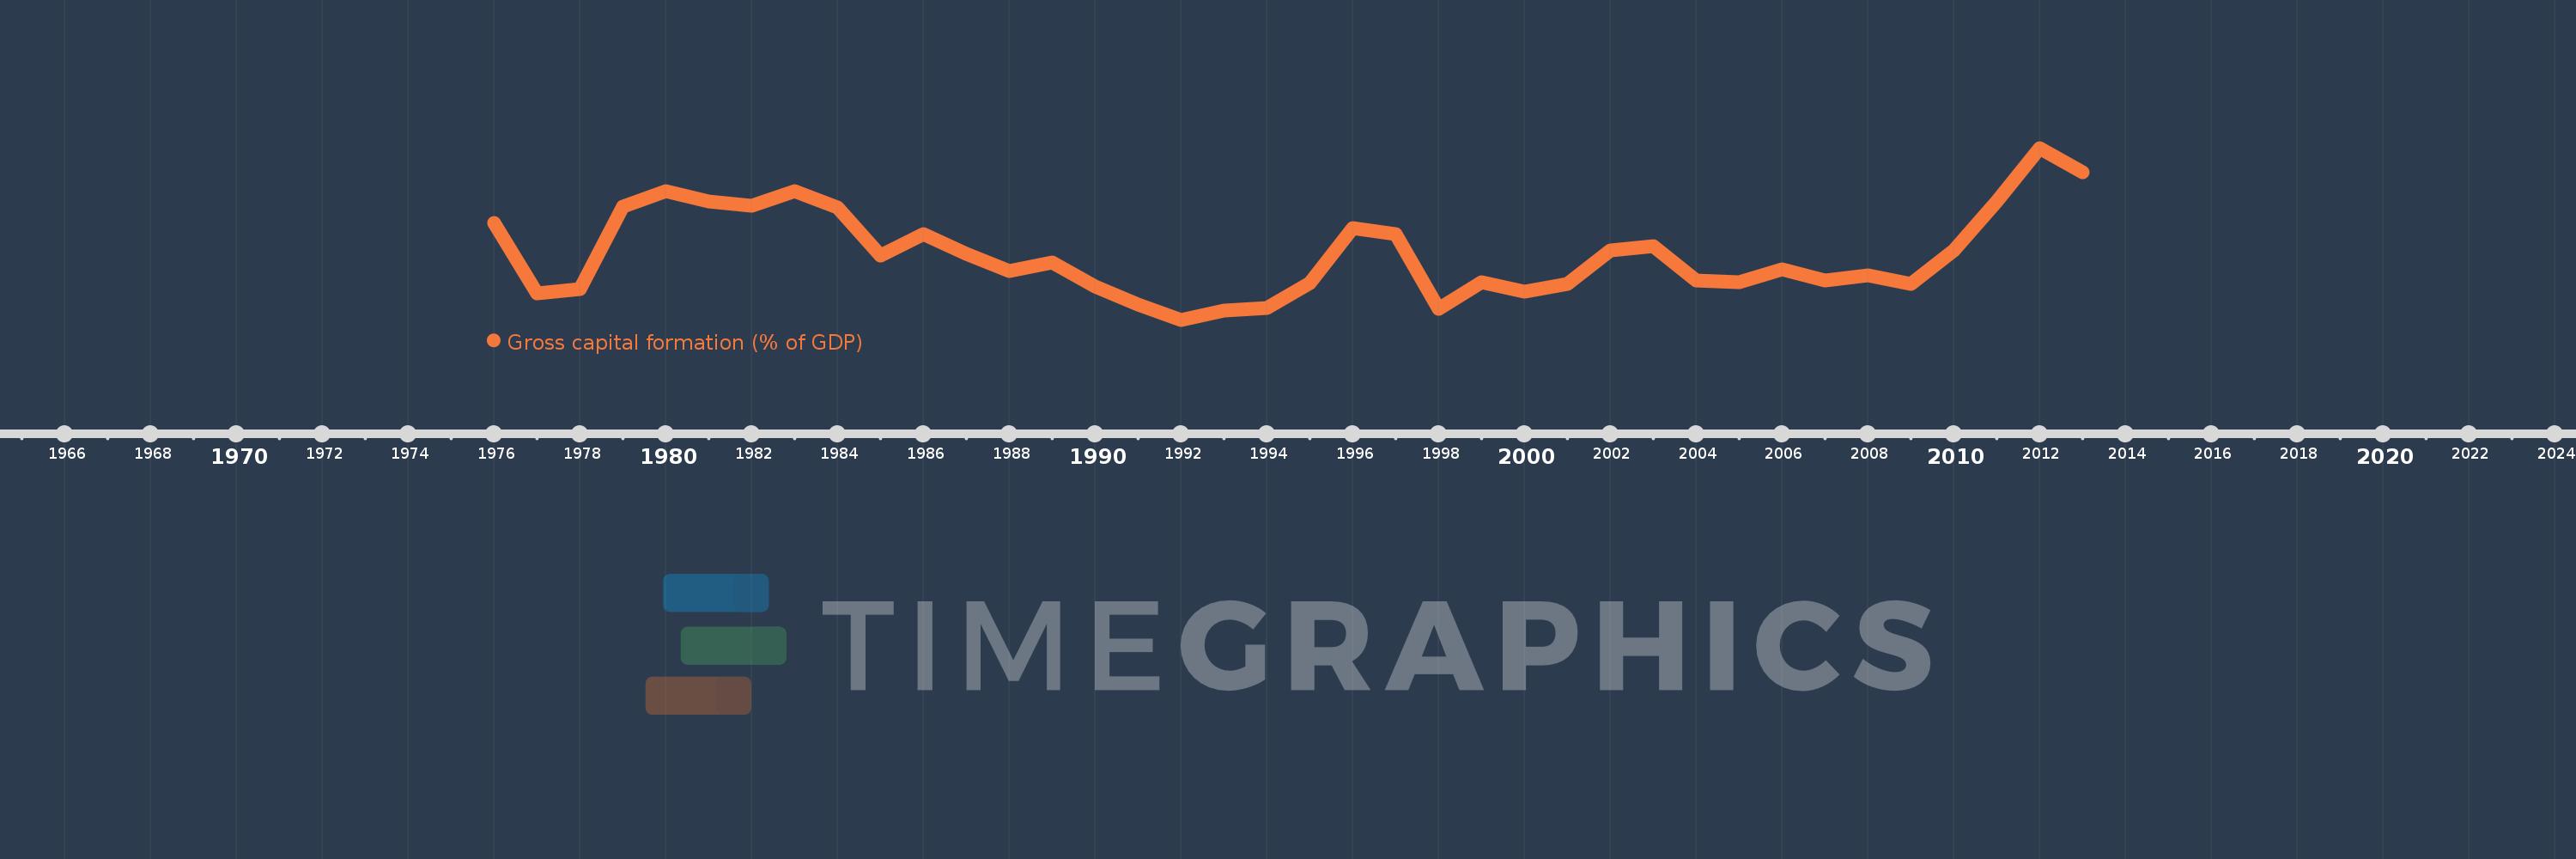
Gross capital formation (% of GDP)
2013,2012,2011,2010,2009,2008,2007,2006,2005,2004,2003,2002,2001,2000,1999,1998,1997,1996,1995,1994,1993,1992,1991,1990,1989,1988,1987,1986,1985,1984,1983,1982,1981,1980,1979,1978,1977,1976
Cette statistique dans les autres pays:
AfghanistanAlbaniaAlgeriaAngolaAntigua and BarbudaArab WorldArgentinaArmeniaArubaAustraliaAustriaAzerbaijanBahamas, TheBahrainBangladeshBarbadosBelarusBelgiumBelizeBeninBermudaBhutanBoliviaBosnia and HerzegovinaBotswanaBrazilBrunei DarussalamBulgariaBurkina FasoBurundiCabo VerdeCambodiaCameroonCanadaCaribbean small statesCentral African RepublicCentral Europe and the BalticsChadChileChinaColombiaComorosCongo, Dem. Rep.Congo, Rep.Costa RicaCote d'IvoireCroatiaCubaCyprusCzech RepublicDenmarkDjiboutiDominicaDominican RepublicEarly-demographic dividendEast Asia & PacificEast Asia & Pacific (excluding high income)East Asia & Pacific (IDA & IBRD countries)EcuadorEgypt, Arab Rep.El SalvadorEquatorial GuineaEritreaEstoniaEthiopiaEuro areaEurope & Central AsiaEurope & Central Asia (excluding high income)Europe & Central Asia (IDA & IBRD countries)European UnionFaroe IslandsFijiFinlandFragile and conflict affected situationsFranceGabonGambia, TheGeorgiaGermanyGhanaGreeceGrenadaGuatemalaGuineaGuinea-BissauGuyanaHaitiHeavily indebted poor countries (HIPC)High incomeHondurasHong Kong SAR, ChinaHungaryIBRD onlyIcelandIDA & IBRD totalIDA blendIDA onlyIDA totalIndiaIndonesiaIran, Islamic Rep.IraqIrelandIsraelItalyJamaicaJapanJordanKazakhstanKenyaKiribatiKorea, Rep.KosovoKuwaitKyrgyz RepublicLao PDRLate-demographic dividendLatin America & Caribbean Latin America & Caribbean (excluding high income)Latin America & the Caribbean (IDA & IBRD countries)LatviaLeast developed countries: UN classificationLebanonLesothoLiberiaLibyaLithuaniaLow & middle incomeLow incomeLower middle incomeLuxembourgMacao SAR, ChinaMacedonia, FYRMadagascarMalawiMalaysiaMaldivesMaliMaltaMauritaniaMauritiusMexicoMicronesia, Fed. Sts.Middle East & North AfricaMiddle East & North Africa (excluding high income)Middle East & North Africa (IDA & IBRD countries)Middle incomeMoldovaMongoliaMontenegroMoroccoMozambiqueNamibiaNepalNetherlandsNew CaledoniaNew ZealandNicaraguaNigerNigeriaNorth AmericaNorwayOECD membersOmanOther small statesPacific island small statesPakistanPanamaPapua New GuineaParaguayPeruPhilippinesPolandPortugalPost-demographic dividendPre-demographic dividendPuerto RicoQatarRomaniaRussian FederationRwandaSaudi ArabiaSenegalSerbiaSeychellesSierra LeoneSingaporeSlovak RepublicSloveniaSmall statesSolomon IslandsSomaliaSouth AfricaSouth AsiaSouth Asia (IDA & IBRD)South SudanSpainSri LankaSt. Kitts and NevisSt. LuciaSt. Vincent and the GrenadinesSub-Saharan Africa Sub-Saharan Africa (excluding high income)Sub-Saharan Africa (IDA & IBRD countries)SudanSurinameSwazilandSwedenSwitzerlandSyrian Arab RepublicTajikistanTanzaniaThailandTimor-LesteTogoTongaTrinidad and TobagoTunisiaTurkeyTurkmenistanUgandaUkraineUnited Arab EmiratesUnited KingdomUnited StatesUpper middle incomeUruguayUzbekistanVanuatuVenezuela, RBVietnamWest Bank and GazaWorldYemen, Rep.ZambiaZimbabwe La ligne de temps
Cette échelle de temps montre un graphique de 1976 année à 2013 année Tonga. Les données jusqu'à 1975 année ne sont pas présentés. Quantité d'observations actuelles selon dates: 38.
Source (désignation):
Les indicateurs du développement mondiale
Source (organisation):
World Bank national accounts data, and OECD National Accounts data files.
Catégories:
Economy & Growth
Dernière mise à jour
23 avr. 2017
Les indicateurs de changement de valeurs selon les années
Minimum:
16.738
1 janv. 1992
Maximum:
36.079
1 janv. 2012
Pour la date d''observation
Valeur
Changement absolu
Le changement par rapport à la valeur précédente
1 janv. 1976
27.593
+27.593
0.0%
1 janv. 1977
19.669
-7.924
-28.72%
1 janv. 1978
20.198
+0.529
2.69%
1 janv. 1979
29.509
+9.312
46.1%
1 janv. 1980
31.167
+1.658
5.62%
1 janv. 1981
30.056
-1.111
-3.56%
1 janv. 1982
29.561
-0.495
-1.65%
1 janv. 1983
31.223
+1.662
5.62%
1 janv. 1984
29.346
-1.876
-6.01%
1 janv. 1985
23.938
-5.409
-18.43%
1 janv. 1986
26.384
+2.447
10.22%
1 janv. 1987
24.131
-2.253
-8.54%
1 janv. 1988
22.174
-1.957
-8.11%
1 janv. 1989
23.168
+0.994
4.48%
1 janv. 1990
20.445
-2.722
-11.75%
1 janv. 1991
18.493
-1.952
-9.55%
1 janv. 1992
16.738
-1.755
-9.49%
1 janv. 1993
17.728
+0.99
5.91%
1 janv. 1994
18.094
+0.366
2.06%
1 janv. 1995
20.836
+2.743
15.16%
1 janv. 1996
27.077
+6.241
29.95%
1 janv. 1997
26.416
-0.661
-2.44%
1 janv. 1998
17.925
-8.492
-32.15%
1 janv. 1999
20.927
+3.002
16.75%
1 janv. 2000
19.863
-1.064
-5.08%
1 janv. 2001
20.77
+0.908
4.57%
1 janv. 2002
24.508
+3.737
17.99%
1 janv. 2003
25.015
+0.508
2.07%
1 janv. 2004
21.135
-3.88
-15.51%
1 janv. 2005
20.979
-0.156
-0.74%
1 janv. 2006
22.446
+1.467
6.99%
1 janv. 2007
21.117
-1.329
-5.92%
1 janv. 2008
21.731
+0.614
2.91%
1 janv. 2009
20.816
-0.914
-4.21%
1 janv. 2010
24.543
+3.727
17.9%
1 janv. 2011
30.092
+5.549
22.61%
1 janv. 2012
36.079
+5.986
19.89%
1 janv. 2013
33.372
-2.707
-7.5%
Classement des pays selon les statistiques actuelles par années


Commentaires: