29
/fr/
fr
AIzaSyAYiBZKx7MnpbEhh9jyipgxe19OcubqV5w
April 1, 2024
26634
Early-demographic dividend
EAR
false
2
1
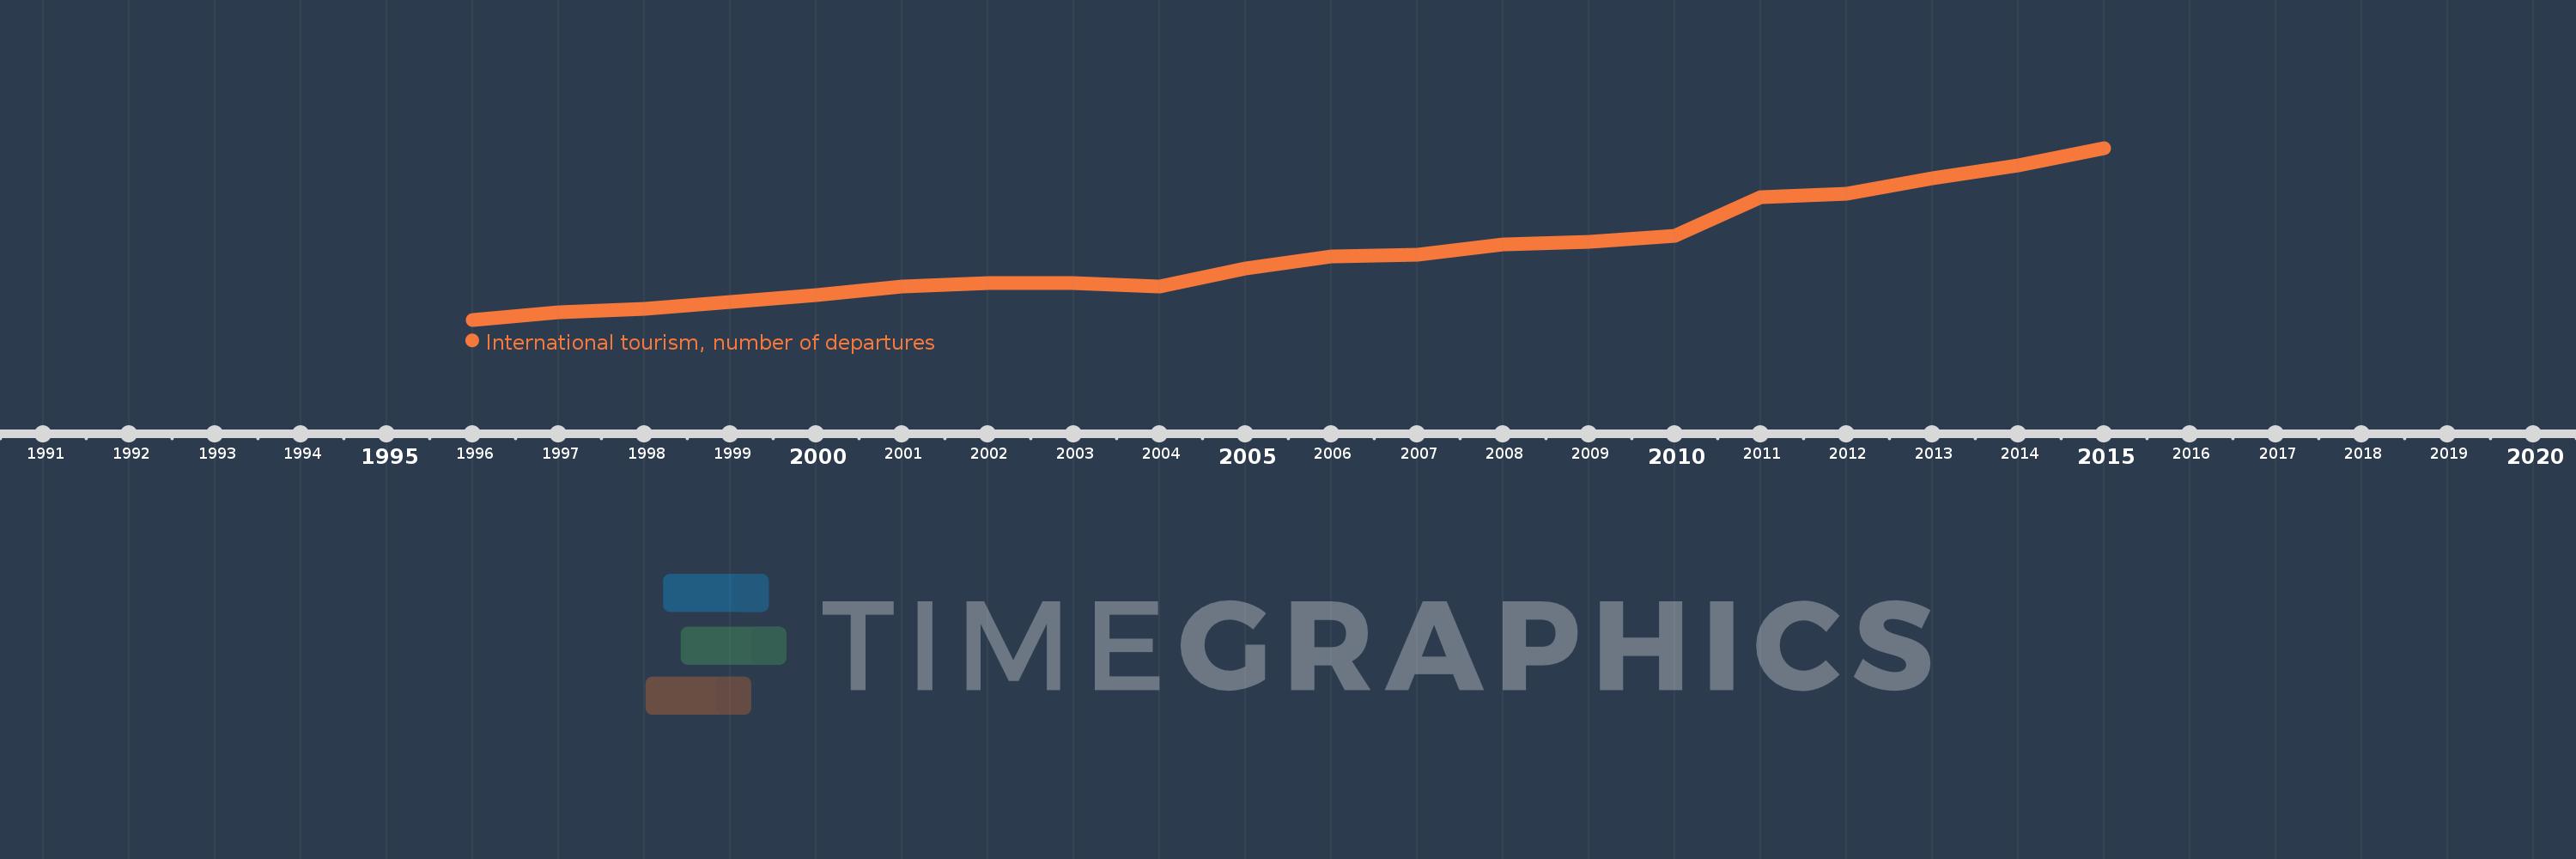
International tourism, number of departures
2015,2014,2013,2012,2011,2010,2009,2008,2007,2006,2005,2004,2003,2002,2001,2000,1999,1998,1997,1996
Cette statistique dans les autres pays:
La ligne de temps
Cette échelle de temps montre un graphique de 1996 année à 2015 année Early-demographic dividend. Les données jusqu'à 1995 année ne sont pas présentés. Quantité d'observations actuelles selon dates: 20.
Source (désignation):
Les indicateurs du développement mondiale
Source (organisation):
World Tourism Organization, Yearbook of Tourism Statistics, Compendium of Tourism Statistics and data files.
Catégories:
Private Sector, Trade
Dernière mise à jour
23 avr. 2017
Les indicateurs de changement de valeurs selon les années
Minimum:
52.902 mln.
1 janv. 1996
Maximum:
165.587 mln.
1 janv. 2015
Pour la date d''observation
Valeur
Changement absolu
Le changement par rapport à la valeur précédente
1 janv. 1996
52.902 mln.
+52.902 mln.
0.0%
1 janv. 1997
57.588 mln.
+4.686 mln.
8.86%
1 janv. 1998
60.114 mln.
+2.526 mln.
4.39%
1 janv. 1999
64.694 mln.
+4.58 mln.
7.62%
1 janv. 2000
69.249 mln.
+4.555 mln.
7.04%
1 janv. 2001
74.979 mln.
+5.73 mln.
8.27%
1 janv. 2002
76.922 mln.
+1.943 mln.
2.59%
1 janv. 2003
77.189 mln.
+266.445 milles
0.35%
1 janv. 2004
74.966 mln.
-2.222 mln.
-2.88%
1 janv. 2005
86.343 mln.
+11.376 mln.
15.18%
1 janv. 2006
94.238 mln.
+7.895 mln.
9.14%
1 janv. 2007
95.719 mln.
+1.481 mln.
1.57%
1 janv. 2008
102.144 mln.
+6.425 mln.
6.71%
1 janv. 2009
104.037 mln.
+1.893 mln.
1.85%
1 janv. 2010
108.14 mln.
+4.103 mln.
3.94%
1 janv. 2011
133.364 mln.
+25.224 mln.
23.32%
1 janv. 2012
135.796 mln.
+2.433 mln.
1.82%
1 janv. 2013
145.495 mln.
+9.699 mln.
7.14%
1 janv. 2014
154.077 mln.
+8.582 mln.
5.9%
1 janv. 2015
165.587 mln.
+11.509 mln.
7.47%
Classement des pays selon les statistiques actuelles par années


Commentaires: