29
/fr/
fr
AIzaSyAYiBZKx7MnpbEhh9jyipgxe19OcubqV5w
April 1, 2024
25815
Central Europe and the Baltics
CEB
false
2
1
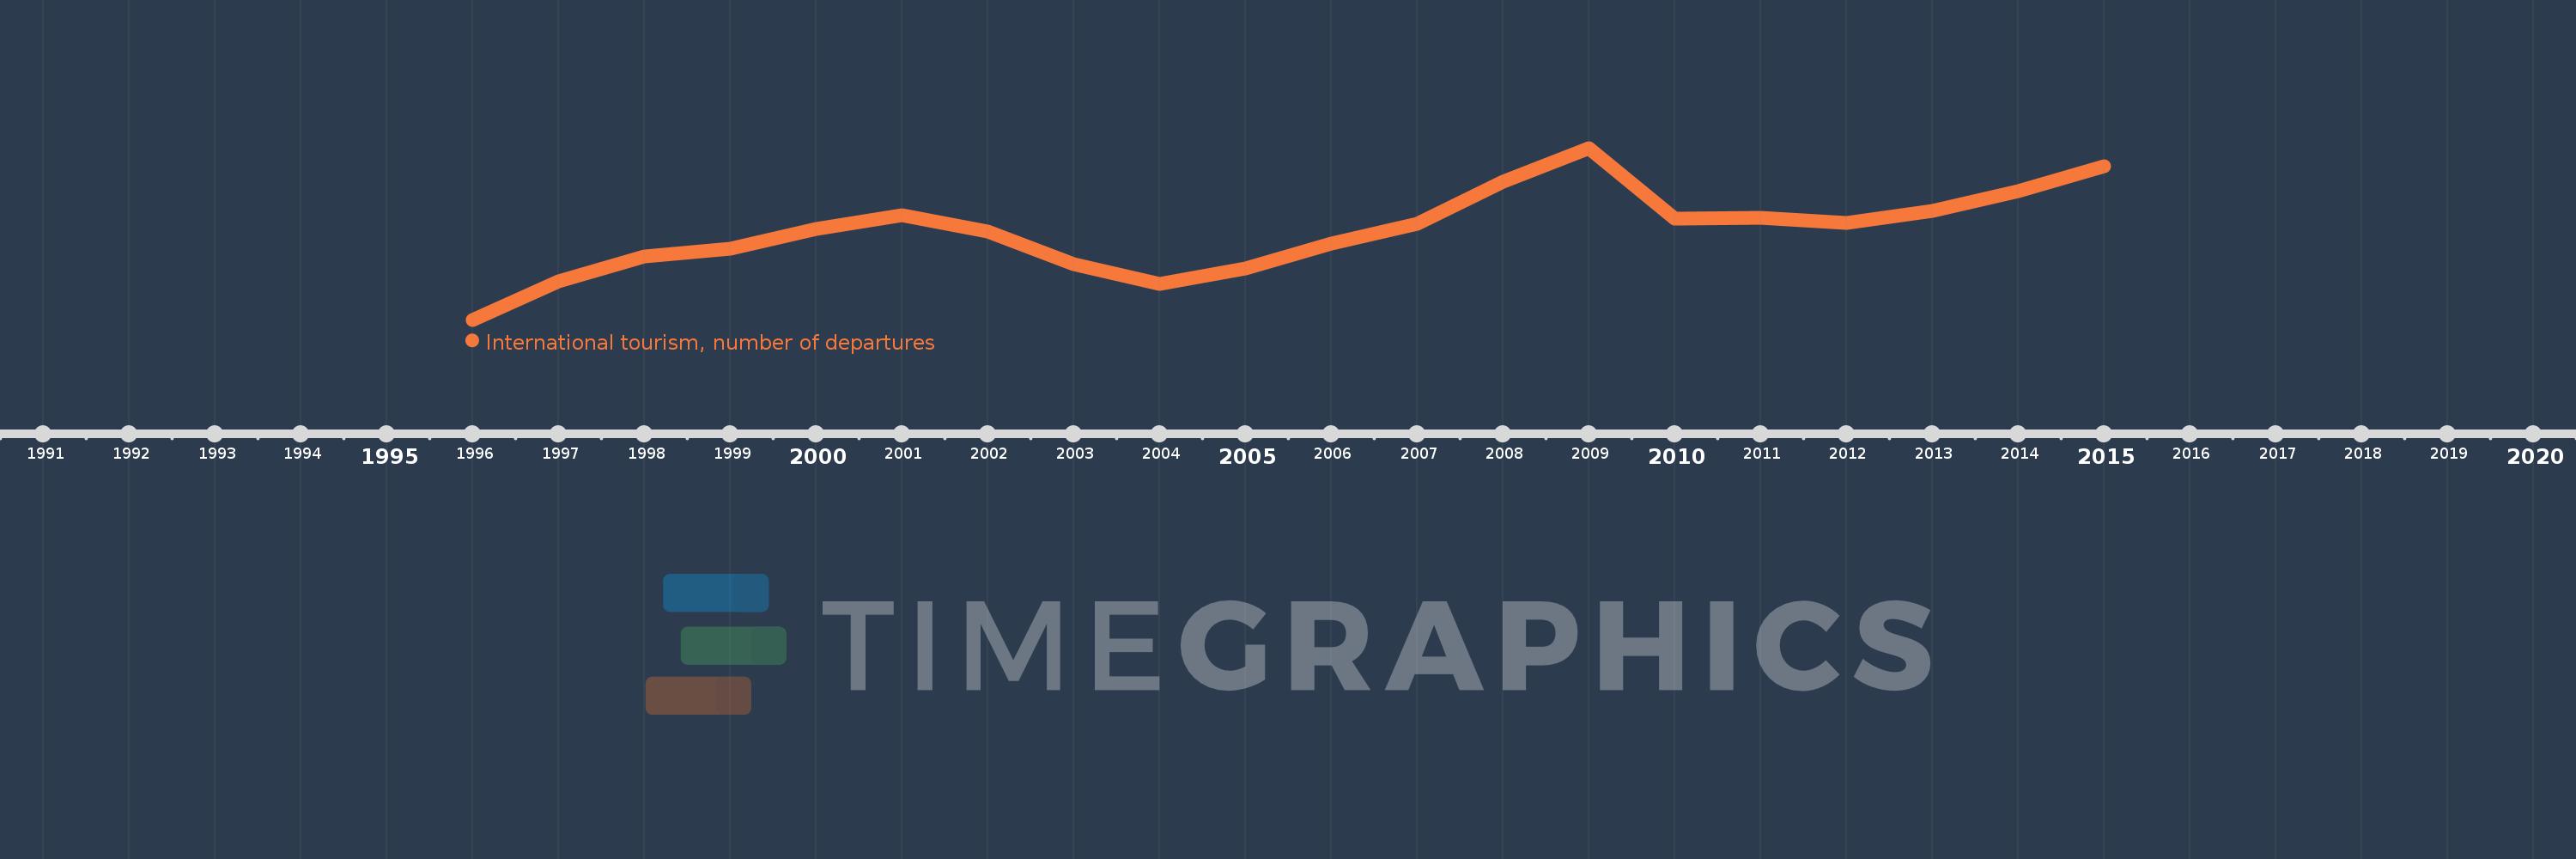
International tourism, number of departures
2015,2014,2013,2012,2011,2010,2009,2008,2007,2006,2005,2004,2003,2002,2001,2000,1999,1998,1997,1996
Cette statistique dans les autres pays:
La ligne de temps
Cette échelle de temps montre un graphique de 1996 année à 2015 année Central Europe and the Baltics. Les données jusqu'à 1995 année ne sont pas présentés. Quantité d'observations actuelles selon dates: 20.
Source (désignation):
Les indicateurs du développement mondiale
Source (organisation):
World Tourism Organization, Yearbook of Tourism Statistics, Compendium of Tourism Statistics and data files.
Catégories:
Private Sector, Trade
Dernière mise à jour
23 avr. 2017
Les indicateurs de changement de valeurs selon les années
Minimum:
72.854 mln.
1 janv. 1996
Maximum:
110.599 mln.
1 janv. 2009
Pour la date d''observation
Valeur
Changement absolu
Le changement par rapport à la valeur précédente
1 janv. 1996
72.854 mln.
+72.854 mln.
0.0%
1 janv. 1997
81.37 mln.
+8.516 mln.
11.69%
1 janv. 1998
86.835 mln.
+5.466 mln.
6.72%
1 janv. 1999
88.46 mln.
+1.624 mln.
1.87%
1 janv. 2000
92.884 mln.
+4.425 mln.
5.0%
1 janv. 2001
95.837 mln.
+2.952 mln.
3.18%
1 janv. 2002
92.253 mln.
-3.584 mln.
-3.74%
1 janv. 2003
85.151 mln.
-7.102 mln.
-7.7%
1 janv. 2004
80.795 mln.
-4.356 mln.
-5.12%
1 janv. 2005
84.06 mln.
+3.265 mln.
4.04%
1 janv. 2006
89.502 mln.
+5.441 mln.
6.47%
1 janv. 2007
93.982 mln.
+4.48 mln.
5.01%
1 janv. 2008
103.194 mln.
+9.212 mln.
9.8%
1 janv. 2009
110.599 mln.
+7.405 mln.
7.18%
1 janv. 2010
95.151 mln.
-15.448 mln.
-13.97%
1 janv. 2011
95.233 mln.
+82.0 milles
0.09%
1 janv. 2012
94.046 mln.
-1.187 mln.
-1.25%
1 janv. 2013
96.855 mln.
+2.809 mln.
2.99%
1 janv. 2014
101.06 mln.
+4.205 mln.
4.34%
1 janv. 2015
106.621 mln.
+5.561 mln.
5.5%
Classement des pays selon les statistiques actuelles par années


Commentaires: