29
/fr/
fr
AIzaSyAYiBZKx7MnpbEhh9jyipgxe19OcubqV5w
April 1, 2024
265797
Tonga
TON
true
2
1
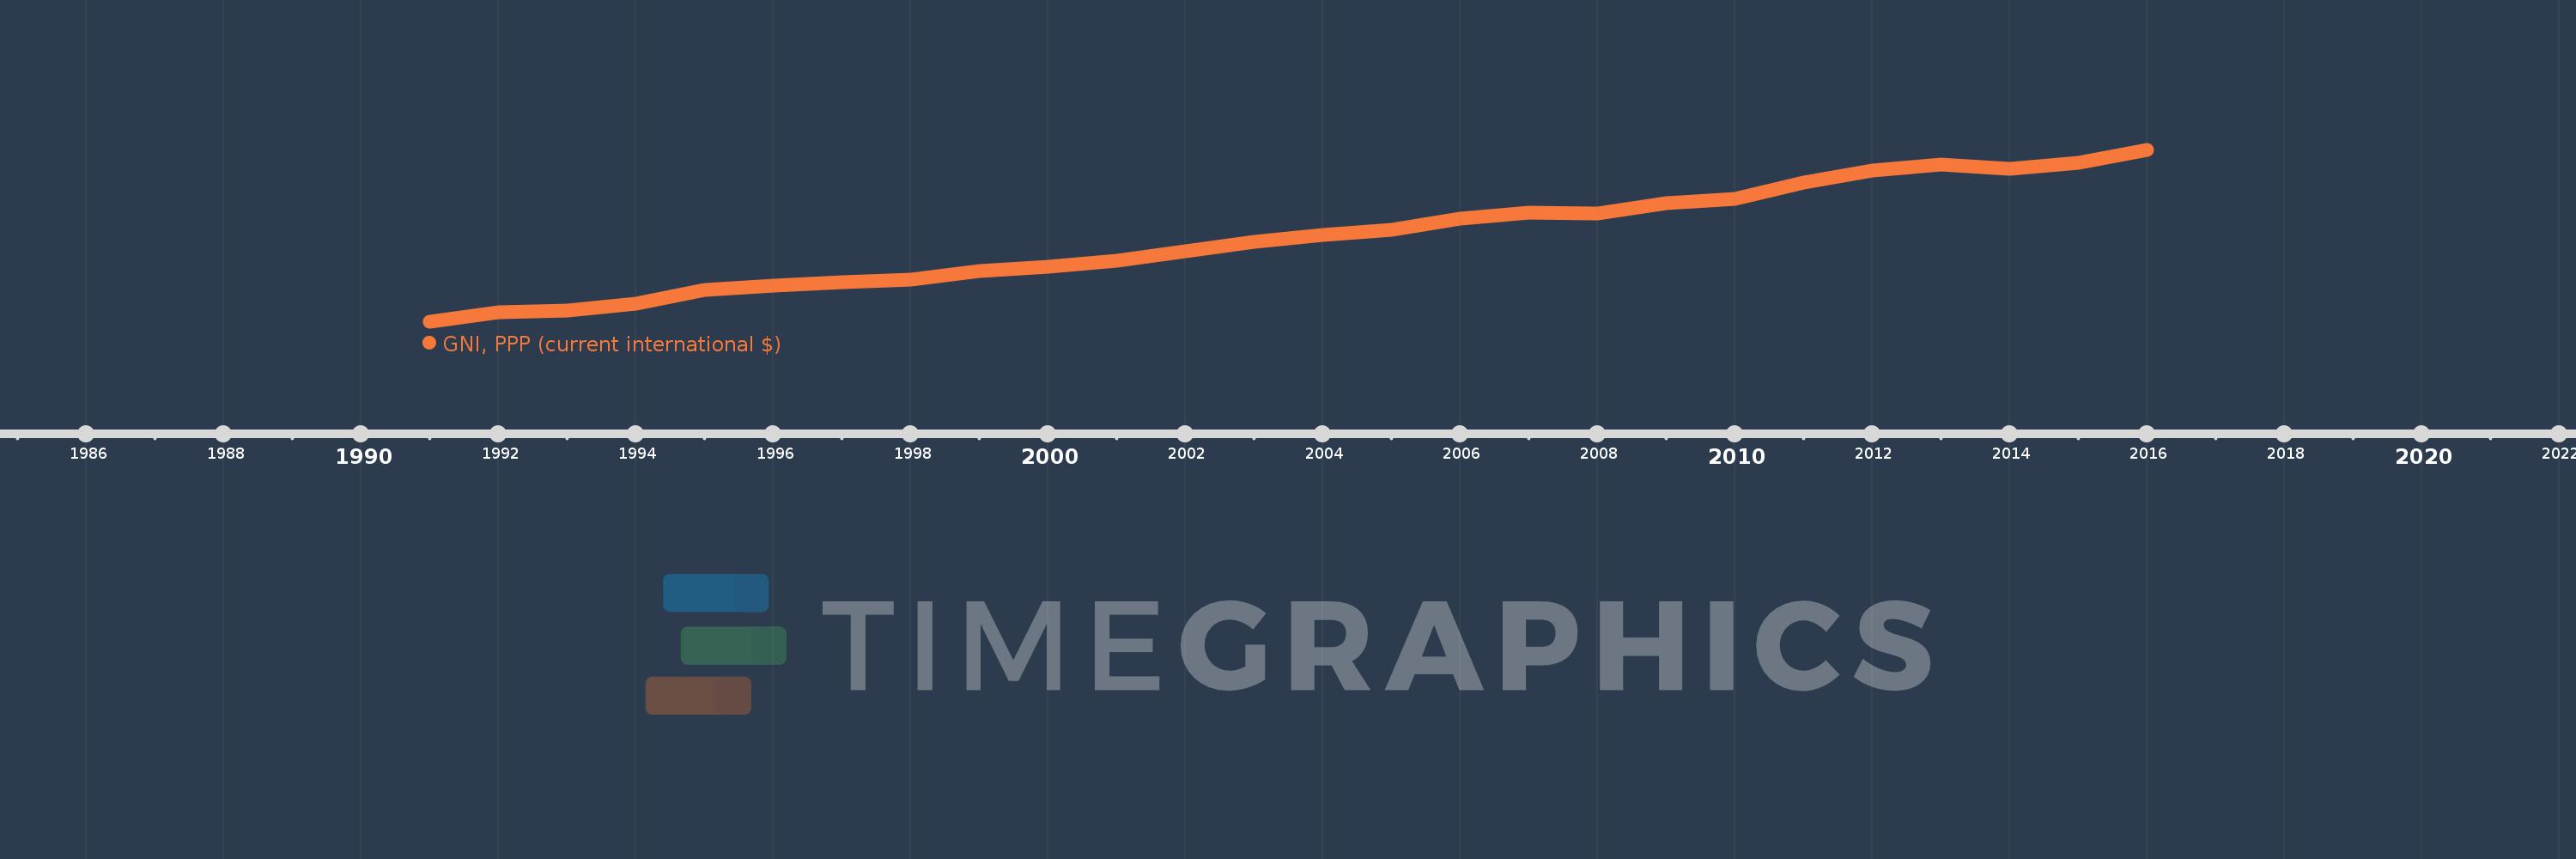
GNI, PPP (current international $)
2016,2015,2014,2013,2012,2011,2010,2009,2008,2007,2006,2005,2004,2003,2002,2001,2000,1999,1998,1997,1996,1995,1994,1993,1992,1991
Cette statistique dans les autres pays:
AfghanistanAlbaniaAlgeriaAngolaAntigua and BarbudaArab WorldArgentinaArmeniaAustraliaAustriaAzerbaijanBahamas, TheBahrainBangladeshBarbadosBelarusBelgiumBelizeBeninBermudaBhutanBoliviaBosnia and HerzegovinaBotswanaBrazilBrunei DarussalamBulgariaBurkina FasoBurundiCabo VerdeCambodiaCameroonCanadaCaribbean small statesCentral African RepublicCentral Europe and the BalticsChadChileChinaColombiaComorosCongo, Dem. Rep.Congo, Rep.Costa RicaCote d'IvoireCroatiaCubaCyprusCzech RepublicDenmarkDjiboutiDominicaDominican RepublicEarly-demographic dividendEast Asia & PacificEast Asia & Pacific (excluding high income)East Asia & Pacific (IDA & IBRD countries)EcuadorEgypt, Arab Rep.El SalvadorEquatorial GuineaEritreaEstoniaEthiopiaEuro areaEurope & Central AsiaEurope & Central Asia (excluding high income)Europe & Central Asia (IDA & IBRD countries)European UnionFijiFinlandFragile and conflict affected situationsFranceGabonGambia, TheGeorgiaGermanyGhanaGreeceGrenadaGuatemalaGuineaGuinea-BissauGuyanaHaitiHeavily indebted poor countries (HIPC)High incomeHondurasHong Kong SAR, ChinaHungaryIBRD onlyIcelandIDA & IBRD totalIDA blendIDA onlyIDA totalIndiaIndonesiaIran, Islamic Rep.IraqIrelandIsraelItalyJamaicaJapanJordanKazakhstanKenyaKiribatiKorea, Rep.KosovoKuwaitKyrgyz RepublicLao PDRLate-demographic dividendLatin America & Caribbean Latin America & Caribbean (excluding high income)Latin America & the Caribbean (IDA & IBRD countries)LatviaLeast developed countries: UN classificationLebanonLesothoLiberiaLibyaLithuaniaLow & middle incomeLow incomeLower middle incomeLuxembourgMacao SAR, ChinaMacedonia, FYRMadagascarMalawiMalaysiaMaldivesMaliMaltaMarshall IslandsMauritaniaMauritiusMexicoMicronesia, Fed. Sts.Middle East & North AfricaMiddle East & North Africa (excluding high income)Middle East & North Africa (IDA & IBRD countries)Middle incomeMoldovaMongoliaMontenegroMoroccoMozambiqueMyanmarNamibiaNauruNepalNetherlandsNew ZealandNicaraguaNigerNigeriaNorth AmericaNorwayOECD membersOmanOther small statesPacific island small statesPakistanPalauPanamaPapua New GuineaParaguayPeruPhilippinesPolandPortugalPost-demographic dividendPre-demographic dividendPuerto RicoQatarRomaniaRussian FederationRwandaSamoaSao Tome and PrincipeSaudi ArabiaSenegalSerbiaSeychellesSierra LeoneSingaporeSlovak RepublicSloveniaSmall statesSolomon IslandsSouth AfricaSouth AsiaSouth Asia (IDA & IBRD)South SudanSpainSri LankaSt. Kitts and NevisSt. LuciaSt. Vincent and the GrenadinesSub-Saharan Africa Sub-Saharan Africa (excluding high income)Sub-Saharan Africa (IDA & IBRD countries)SudanSurinameSwazilandSwedenSwitzerlandTajikistanTanzaniaThailandTimor-LesteTogoTongaTrinidad and TobagoTunisiaTurkeyTurkmenistanTuvaluUgandaUkraineUnited Arab EmiratesUnited KingdomUnited StatesUpper middle incomeUruguayUzbekistanVanuatuVenezuela, RBVietnamWest Bank and GazaWorldYemen, Rep.ZambiaZimbabwe La ligne de temps
Cette échelle de temps montre un graphique de 1991 année à 2016 année Tonga. Les données jusqu'à 1990 année ne sont pas présentés. Quantité d'observations actuelles selon dates: 26.
Source (désignation):
Les indicateurs du développement mondiale
Source (organisation):
World Bank, International Comparison Program database.
Catégories:
Economy & Growth
Dernière mise à jour
23 avr. 2017
Les indicateurs de changement de valeurs selon les années
Minimum:
225.508 mln.
1 janv. 1991
Maximum:
593.707 mln.
1 janv. 2016
Pour la date d''observation
Valeur
Changement absolu
Le changement par rapport à la valeur précédente
1 janv. 1991
225.508 mln.
+225.508 mln.
0.0%
1 janv. 1992
245.935 mln.
+20.427 mln.
9.06%
1 janv. 1993
250.565 mln.
+4.63 mln.
1.88%
1 janv. 1994
265.25 mln.
+14.685 mln.
5.86%
1 janv. 1995
294.987 mln.
+29.738 mln.
11.21%
1 janv. 1996
304.133 mln.
+9.145 mln.
3.1%
1 janv. 1997
311.134 mln.
+7.001 mln.
2.3%
1 janv. 1998
316.352 mln.
+5.219 mln.
1.68%
1 janv. 1999
334.231 mln.
+17.878 mln.
5.65%
1 janv. 2000
343.421 mln.
+9.19 mln.
2.75%
1 janv. 2001
356.381 mln.
+12.96 mln.
3.77%
1 janv. 2002
376.7 mln.
+20.318 mln.
5.7%
1 janv. 2003
396.897 mln.
+20.198 mln.
5.36%
1 janv. 2004
411.463 mln.
+14.565 mln.
3.67%
1 janv. 2005
423.77 mln.
+12.307 mln.
2.99%
1 janv. 2006
447.738 mln.
+23.969 mln.
5.66%
1 janv. 2007
459.371 mln.
+11.633 mln.
2.6%
1 janv. 2008
458.356 mln.
-1.015 mln.
-0.22%
1 janv. 2009
480.062 mln.
+21.706 mln.
4.74%
1 janv. 2010
489.563 mln.
+9.501 mln.
1.98%
1 janv. 2011
524.938 mln.
+35.374 mln.
7.23%
1 janv. 2012
549.832 mln.
+24.894 mln.
4.74%
1 janv. 2013
562.196 mln.
+12.364 mln.
2.25%
1 janv. 2014
553.291 mln.
-8.904 mln.
-1.58%
1 janv. 2015
566.566 mln.
+13.275 mln.
2.4%
1 janv. 2016
593.707 mln.
+27.14 mln.
4.79%
Classement des pays selon les statistiques actuelles par années


Commentaires: