29
/fr/
fr
AIzaSyAYiBZKx7MnpbEhh9jyipgxe19OcubqV5w
April 1, 2024
153571
Iceland
ISL
true
2
1
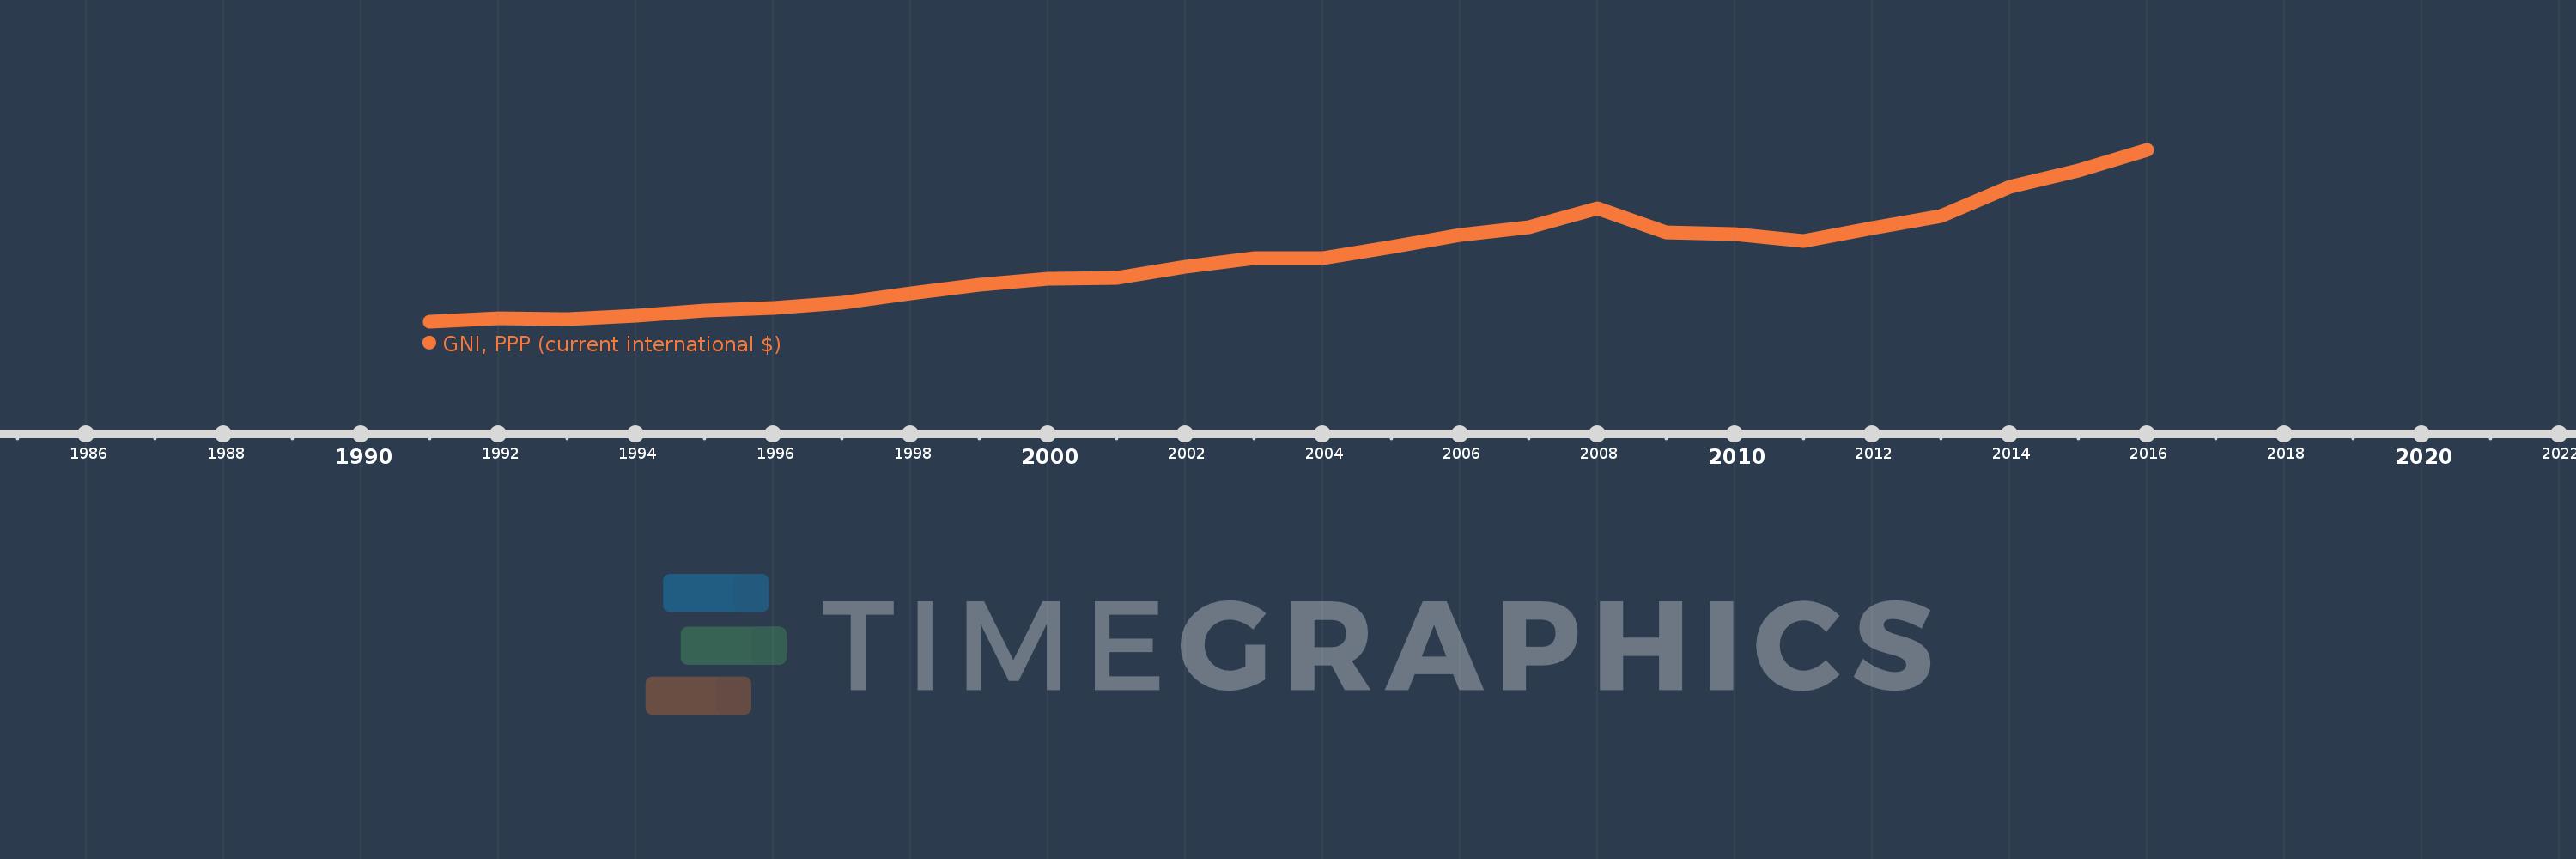
GNI, PPP (current international $)
2016,2015,2014,2013,2012,2011,2010,2009,2008,2007,2006,2005,2004,2003,2002,2001,2000,1999,1998,1997,1996,1995,1994,1993,1992,1991
Cette statistique dans les autres pays:
AfghanistanAlbaniaAlgeriaAngolaAntigua and BarbudaArab WorldArgentinaArmeniaAustraliaAustriaAzerbaijanBahamas, TheBahrainBangladeshBarbadosBelarusBelgiumBelizeBeninBermudaBhutanBoliviaBosnia and HerzegovinaBotswanaBrazilBrunei DarussalamBulgariaBurkina FasoBurundiCabo VerdeCambodiaCameroonCanadaCaribbean small statesCentral African RepublicCentral Europe and the BalticsChadChileChinaColombiaComorosCongo, Dem. Rep.Congo, Rep.Costa RicaCote d'IvoireCroatiaCubaCyprusCzech RepublicDenmarkDjiboutiDominicaDominican RepublicEarly-demographic dividendEast Asia & PacificEast Asia & Pacific (excluding high income)East Asia & Pacific (IDA & IBRD countries)EcuadorEgypt, Arab Rep.El SalvadorEquatorial GuineaEritreaEstoniaEthiopiaEuro areaEurope & Central AsiaEurope & Central Asia (excluding high income)Europe & Central Asia (IDA & IBRD countries)European UnionFijiFinlandFragile and conflict affected situationsFranceGabonGambia, TheGeorgiaGermanyGhanaGreeceGrenadaGuatemalaGuineaGuinea-BissauGuyanaHaitiHeavily indebted poor countries (HIPC)High incomeHondurasHong Kong SAR, ChinaHungaryIBRD onlyIcelandIDA & IBRD totalIDA blendIDA onlyIDA totalIndiaIndonesiaIran, Islamic Rep.IraqIrelandIsraelItalyJamaicaJapanJordanKazakhstanKenyaKiribatiKorea, Rep.KosovoKuwaitKyrgyz RepublicLao PDRLate-demographic dividendLatin America & Caribbean Latin America & Caribbean (excluding high income)Latin America & the Caribbean (IDA & IBRD countries)LatviaLeast developed countries: UN classificationLebanonLesothoLiberiaLibyaLithuaniaLow & middle incomeLow incomeLower middle incomeLuxembourgMacao SAR, ChinaMacedonia, FYRMadagascarMalawiMalaysiaMaldivesMaliMaltaMarshall IslandsMauritaniaMauritiusMexicoMicronesia, Fed. Sts.Middle East & North AfricaMiddle East & North Africa (excluding high income)Middle East & North Africa (IDA & IBRD countries)Middle incomeMoldovaMongoliaMontenegroMoroccoMozambiqueMyanmarNamibiaNauruNepalNetherlandsNew ZealandNicaraguaNigerNigeriaNorth AmericaNorwayOECD membersOmanOther small statesPacific island small statesPakistanPalauPanamaPapua New GuineaParaguayPeruPhilippinesPolandPortugalPost-demographic dividendPre-demographic dividendPuerto RicoQatarRomaniaRussian FederationRwandaSamoaSao Tome and PrincipeSaudi ArabiaSenegalSerbiaSeychellesSierra LeoneSingaporeSlovak RepublicSloveniaSmall statesSolomon IslandsSouth AfricaSouth AsiaSouth Asia (IDA & IBRD)South SudanSpainSri LankaSt. Kitts and NevisSt. LuciaSt. Vincent and the GrenadinesSub-Saharan Africa Sub-Saharan Africa (excluding high income)Sub-Saharan Africa (IDA & IBRD countries)SudanSurinameSwazilandSwedenSwitzerlandTajikistanTanzaniaThailandTimor-LesteTogoTongaTrinidad and TobagoTunisiaTurkeyTurkmenistanTuvaluUgandaUkraineUnited Arab EmiratesUnited KingdomUnited StatesUpper middle incomeUruguayUzbekistanVanuatuVenezuela, RBVietnamWest Bank and GazaWorldYemen, Rep.ZambiaZimbabwe La ligne de temps
Cette échelle de temps montre un graphique de 1991 année à 2016 année Iceland. Les données jusqu'à 1990 année ne sont pas présentés. Quantité d'observations actuelles selon dates: 26.
Source (désignation):
Les indicateurs du développement mondiale
Source (organisation):
World Bank, International Comparison Program database.
Catégories:
Economy & Growth
Dernière mise à jour
23 avr. 2017
Les indicateurs de changement de valeurs selon les années
Minimum:
5.444 mds
1 janv. 1991
Maximum:
15.601 mds
1 janv. 2016
Pour la date d''observation
Valeur
Changement absolu
Le changement par rapport à la valeur précédente
1 janv. 1991
5.444 mds
+5.444 mds
0.0%
1 janv. 1992
5.654 mds
+209.816 mln.
3.85%
1 janv. 1993
5.61 mds
-43.834 mln.
-0.78%
1 janv. 1994
5.808 mds
+198.338 mln.
3.54%
1 janv. 1995
6.104 mds
+295.8 mln.
5.09%
1 janv. 1996
6.256 mds
+152.431 mln.
2.5%
1 janv. 1997
6.559 mds
+302.856 mln.
4.84%
1 janv. 1998
7.13 mds
+570.573 mln.
8.7%
1 janv. 1999
7.642 mds
+511.883 mln.
7.18%
1 janv. 2000
7.974 mds
+332.391 mln.
4.35%
1 janv. 2001
8.032 mds
+57.44 mln.
0.72%
1 janv. 2002
8.722 mds
+690.499 mln.
8.6%
1 janv. 2003
9.208 mds
+486.377 mln.
5.58%
1 janv. 2004
9.207 mds
-1.721 mln.
-0.02%
1 janv. 2005
9.877 mds
+670.547 mln.
7.28%
1 janv. 2006
10.597 mds
+719.478 mln.
7.28%
1 janv. 2007
11.069 mds
+472.459 mln.
4.46%
1 janv. 2008
12.142 mds
+1.073 mds
9.69%
1 janv. 2009
10.748 mds
-1.394 mds
-11.48%
1 janv. 2010
10.634 mds
-114.331 mln.
-1.06%
1 janv. 2011
10.241 mds
-392.388 mln.
-3.69%
1 janv. 2012
10.986 mds
+744.861 mln.
7.27%
1 janv. 2013
11.698 mds
+712.047 mln.
6.48%
1 janv. 2014
13.429 mds
+1.731 mds
14.79%
1 janv. 2015
14.382 mds
+952.919 mln.
7.1%
1 janv. 2016
15.601 mds
+1.219 mds
8.47%
Classement des pays selon les statistiques actuelles par années


Commentaires: