29
/fr/
fr
AIzaSyAYiBZKx7MnpbEhh9jyipgxe19OcubqV5w
April 1, 2024
264188
Togo
TGO
true
2
1
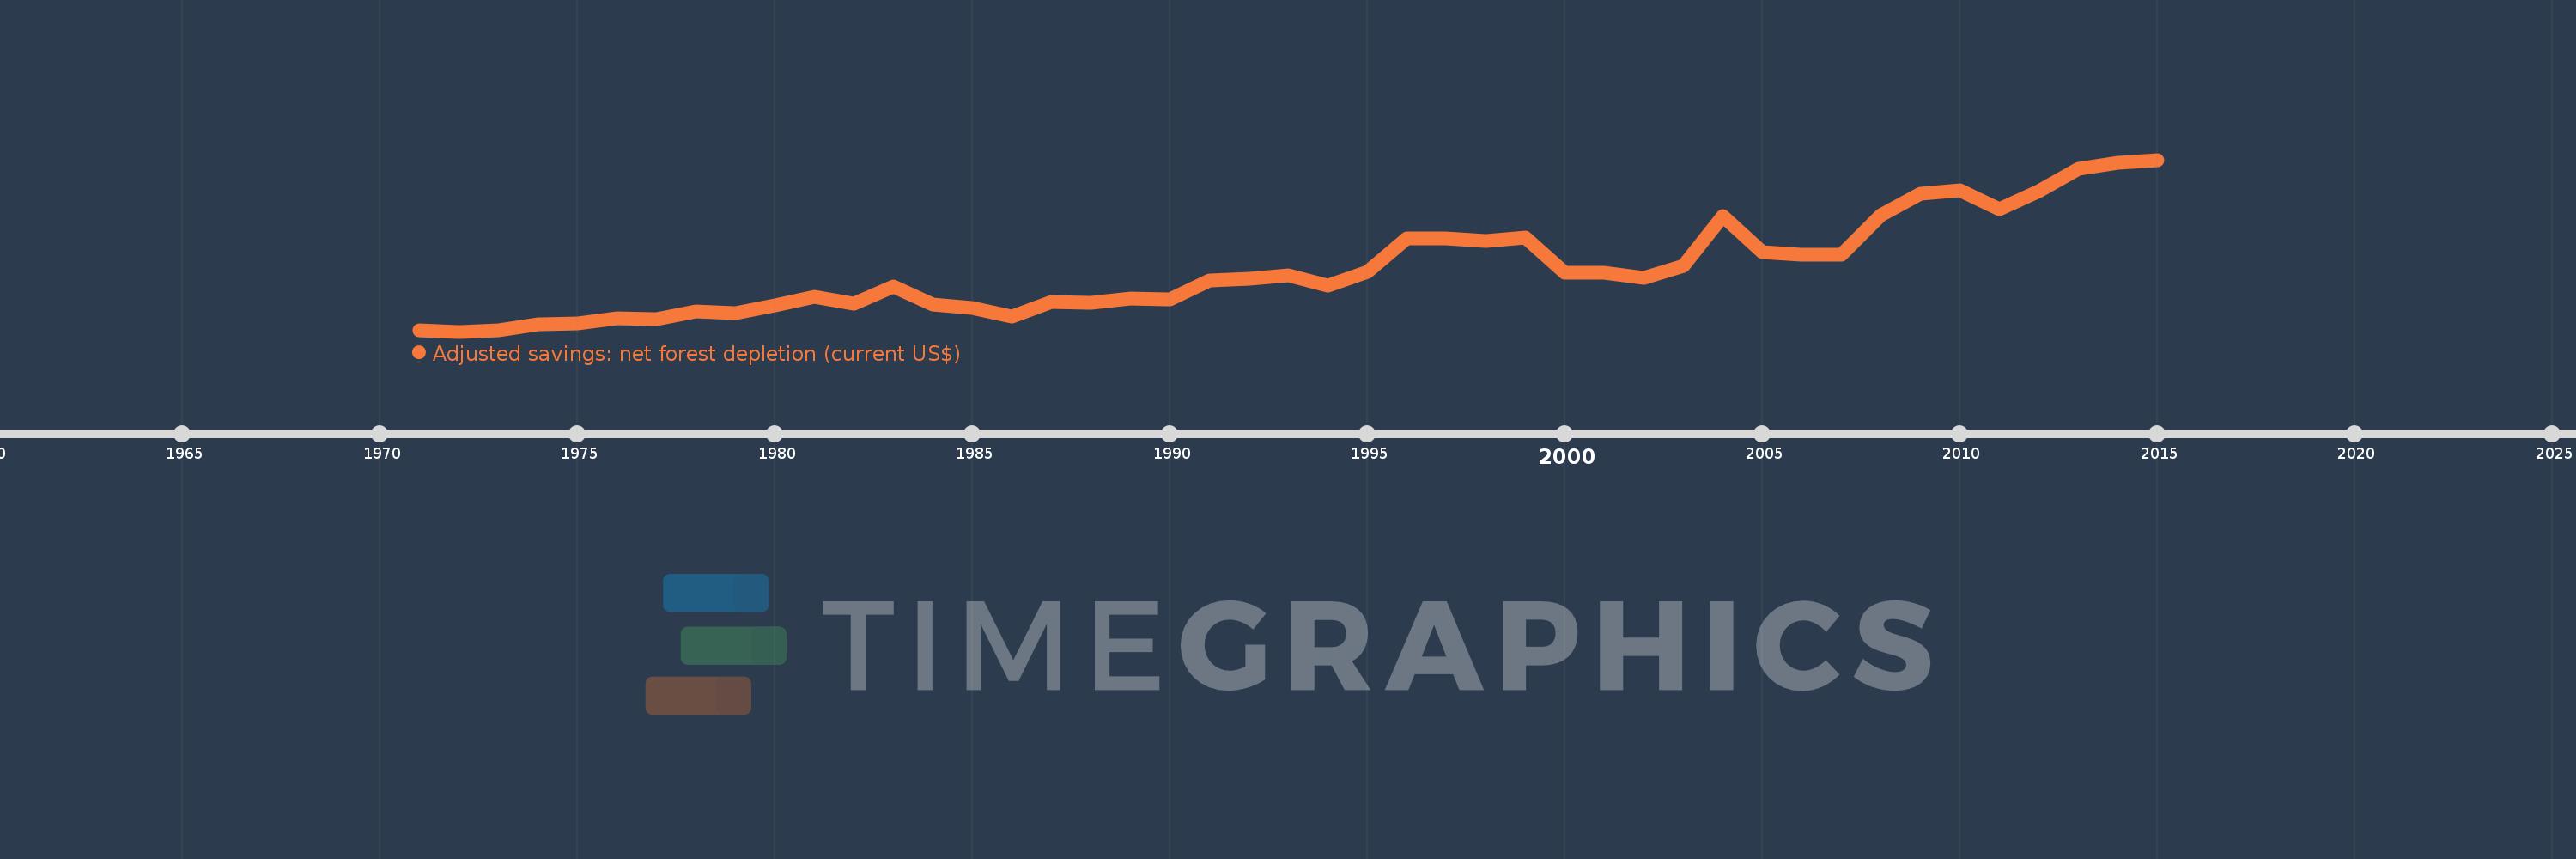
Adjusted savings: net forest depletion (current US$)
2015,2014,2013,2012,2011,2010,2009,2008,2007,2006,2005,2004,2003,2002,2001,2000,1999,1998,1997,1996,1995,1994,1993,1992,1991,1990,1989,1988,1987,1986,1985,1984,1983,1982,1981,1980,1979,1978,1977,1976,1975,1974,1973,1972,1971
Cette statistique dans les autres pays:
AfghanistanAlbaniaAlgeriaAngolaArgentinaArmeniaAustraliaAustriaAzerbaijanBahamas, TheBahrainBangladeshBarbadosBelarusBelgiumBelizeBeninBhutanBoliviaBotswanaBrazilBrunei DarussalamBulgariaBurkina FasoBurundiCabo VerdeCambodiaCameroonCanadaCentral African RepublicChadChileChinaColombiaComorosCongo, Dem. Rep.Congo, Rep.Costa RicaCote d'IvoireCroatiaCubaCyprusCzech RepublicDenmarkDjiboutiDominicaDominican RepublicEcuadorEgypt, Arab Rep.El SalvadorEquatorial GuineaEritreaEstoniaEthiopiaFijiFinlandFranceFrench PolynesiaGabonGambia, TheGeorgiaGermanyGhanaGreeceGuatemalaGuineaGuinea-BissauGuyanaHaitiHondurasHong Kong SAR, ChinaHungaryIcelandIndiaIndonesiaIran, Islamic Rep.IraqIrelandIsraelItalyJamaicaJapanJordanKazakhstanKenyaKiribatiKorea, Dem. People’s Rep.Korea, Rep.KuwaitKyrgyz RepublicLao PDRLatviaLebanonLesothoLiberiaLibyaLithuaniaLuxembourgMacao SAR, ChinaMacedonia, FYRMadagascarMalawiMalaysiaMaldivesMaliMauritaniaMauritiusMexicoMicronesia, Fed. Sts.MoldovaMongoliaMoroccoMozambiqueMyanmarNamibiaNepalNetherlandsNew CaledoniaNew ZealandNicaraguaNigerNigeriaNorwayOmanPakistanPanamaPapua New GuineaParaguayPeruPhilippinesPolandPortugalQatarRomaniaRussian FederationRwandaSamoaSao Tome and PrincipeSaudi ArabiaSenegalSeychellesSierra LeoneSingaporeSlovak RepublicSloveniaSolomon IslandsSomaliaSouth AfricaSpainSri LankaSt. LuciaSt. Vincent and the GrenadinesSudanSurinameSwazilandSwedenSwitzerlandSyrian Arab RepublicTajikistanTanzaniaThailandTogoTongaTrinidad and TobagoTunisiaTurkeyTurkmenistanUgandaUkraineUnited Arab EmiratesUnited KingdomUnited StatesUruguayUzbekistanVanuatuVenezuela, RBVietnamYemen, Rep.ZambiaZimbabwe La ligne de temps
Cette échelle de temps montre un graphique de 1971 année à 2015 année Togo. Les données jusqu'à 1970 année ne sont pas présentés. Quantité d'observations actuelles selon dates: 45.
Source (désignation):
Les indicateurs du développement mondiale
Source (organisation):
World Bank staff estimates based on sources and methods in World Bank's "The Changing Wealth of Nations: Measuring Sustainable Development in the New Millennium" (2011).
Catégories:
Economy & Growth, Environment
Dernière mise à jour
23 avr. 2017
Les indicateurs de changement de valeurs selon les années
Minimum:
9.996 mln.
1 janv. 1972
Maximum:
274.403 mln.
1 janv. 2015
Pour la date d''observation
Valeur
Changement absolu
Le changement par rapport à la valeur précédente
1 janv. 1971
11.368 mln.
+11.368 mln.
0.0%
1 janv. 1972
9.996 mln.
-1.372 mln.
-12.07%
1 janv. 1973
11.607 mln.
+1.611 mln.
16.12%
1 janv. 1974
21.043 mln.
+9.436 mln.
81.29%
1 janv. 1975
22.237 mln.
+1.194 mln.
5.67%
1 janv. 1976
30.414 mln.
+8.177 mln.
36.77%
1 janv. 1977
28.644 mln.
-1.77 mln.
-5.82%
1 janv. 1978
41.638 mln.
+12.994 mln.
45.36%
1 janv. 1979
39.021 mln.
-2.617 mln.
-6.28%
1 janv. 1980
50.501 mln.
+11.48 mln.
29.42%
1 janv. 1981
63.401 mln.
+12.9 mln.
25.54%
1 janv. 1982
52.469 mln.
-10.933 mln.
-17.24%
1 janv. 1983
78.852 mln.
+26.383 mln.
50.28%
1 janv. 1984
51.359 mln.
-27.492 mln.
-34.87%
1 janv. 1985
46.87 mln.
-4.49 mln.
-8.74%
1 janv. 1986
33.213 mln.
-13.657 mln.
-29.14%
1 janv. 1987
54.949 mln.
+21.735 mln.
65.44%
1 janv. 1988
54.268 mln.
-680.412 milles
-1.24%
1 janv. 1989
61.312 mln.
+7.044 mln.
12.98%
1 janv. 1990
59.265 mln.
-2.047 mln.
-3.34%
1 janv. 1991
88.656 mln.
+29.391 mln.
49.59%
1 janv. 1992
91.858 mln.
+3.202 mln.
3.61%
1 janv. 1993
96.468 mln.
+4.61 mln.
5.02%
1 janv. 1994
80.47 mln.
-15.998 mln.
-16.58%
1 janv. 1995
101.232 mln.
+20.762 mln.
25.8%
1 janv. 1996
153.775 mln.
+52.543 mln.
51.9%
1 janv. 1997
153.724 mln.
-50.987 milles
-0.03%
1 janv. 1998
149.53 mln.
-4.194 mln.
-2.73%
1 janv. 1999
154.448 mln.
+4.918 mln.
3.29%
1 janv. 2000
100.885 mln.
-53.563 mln.
-34.68%
1 janv. 2001
100.621 mln.
-264.397 milles
-0.26%
1 janv. 2002
93.048 mln.
-7.573 mln.
-7.53%
1 janv. 2003
110.762 mln.
+17.714 mln.
19.04%
1 janv. 2004
187.482 mln.
+76.72 mln.
69.27%
1 janv. 2005
131.978 mln.
-55.504 mln.
-29.6%
1 janv. 2006
128.979 mln.
-2.999 mln.
-2.27%
1 janv. 2007
127.848 mln.
-1.131 mln.
-0.88%
1 janv. 2008
188.613 mln.
+60.765 mln.
47.53%
1 janv. 2009
221.774 mln.
+33.161 mln.
17.58%
1 janv. 2010
227.785 mln.
+6.011 mln.
2.71%
1 janv. 2011
199.002 mln.
-28.783 mln.
-12.64%
1 janv. 2012
225.602 mln.
+26.599 mln.
13.37%
1 janv. 2013
261.071 mln.
+35.469 mln.
15.72%
1 janv. 2014
269.208 mln.
+8.137 mln.
3.12%
1 janv. 2015
274.403 mln.
+5.195 mln.
1.93%
Classement des pays selon les statistiques actuelles par années


Commentaires: