29
/fr/
fr
AIzaSyAYiBZKx7MnpbEhh9jyipgxe19OcubqV5w
April 1, 2024
130061
Ethiopia
ETH
true
2
1
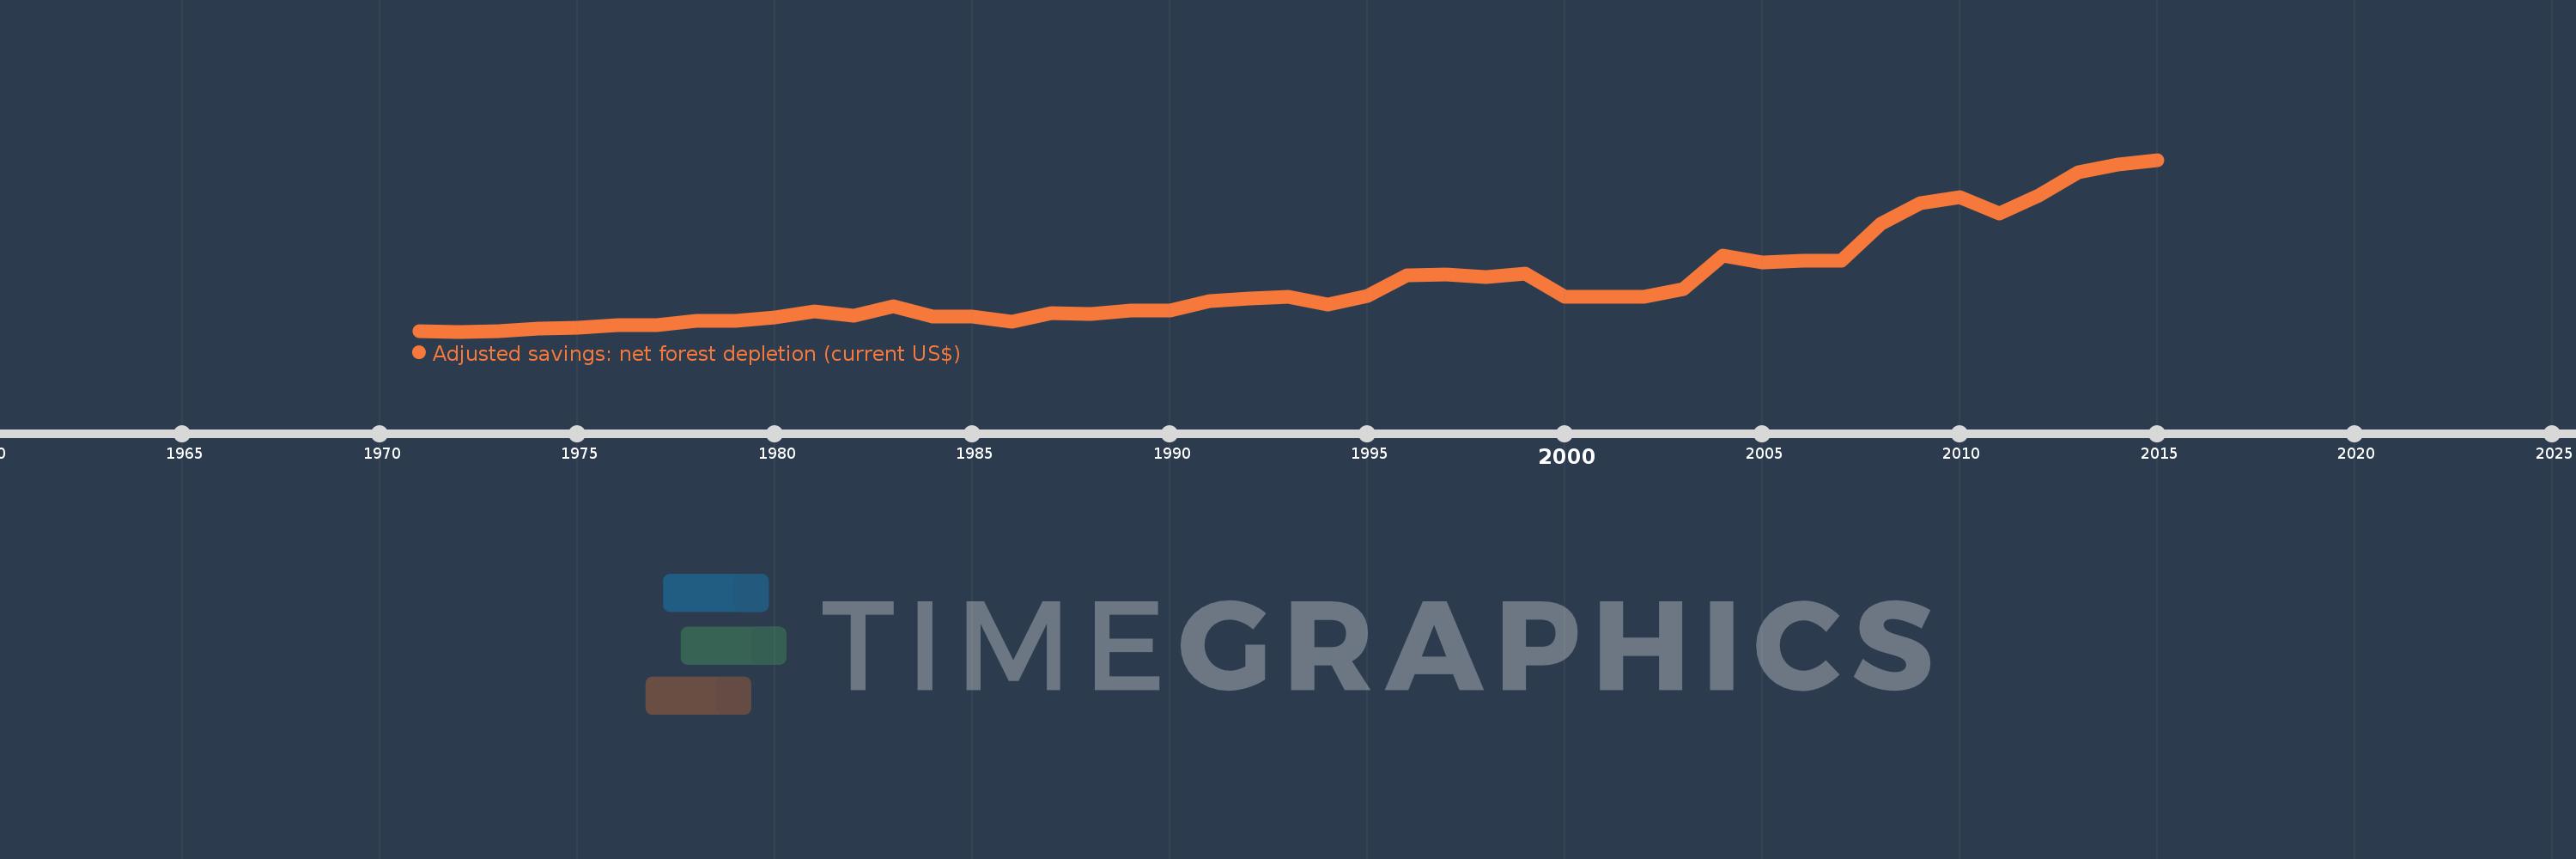
Adjusted savings: net forest depletion (current US$)
2015,2014,2013,2012,2011,2010,2009,2008,2007,2006,2005,2004,2003,2002,2001,2000,1999,1998,1997,1996,1995,1994,1993,1992,1991,1990,1989,1988,1987,1986,1985,1984,1983,1982,1981,1980,1979,1978,1977,1976,1975,1974,1973,1972,1971
Cette statistique dans les autres pays:
AfghanistanAlbaniaAlgeriaAngolaArgentinaArmeniaAustraliaAustriaAzerbaijanBahamas, TheBahrainBangladeshBarbadosBelarusBelgiumBelizeBeninBhutanBoliviaBotswanaBrazilBrunei DarussalamBulgariaBurkina FasoBurundiCabo VerdeCambodiaCameroonCanadaCentral African RepublicChadChileChinaColombiaComorosCongo, Dem. Rep.Congo, Rep.Costa RicaCote d'IvoireCroatiaCubaCyprusCzech RepublicDenmarkDjiboutiDominicaDominican RepublicEcuadorEgypt, Arab Rep.El SalvadorEquatorial GuineaEritreaEstoniaEthiopiaFijiFinlandFranceFrench PolynesiaGabonGambia, TheGeorgiaGermanyGhanaGreeceGuatemalaGuineaGuinea-BissauGuyanaHaitiHondurasHong Kong SAR, ChinaHungaryIcelandIndiaIndonesiaIran, Islamic Rep.IraqIrelandIsraelItalyJamaicaJapanJordanKazakhstanKenyaKiribatiKorea, Dem. People’s Rep.Korea, Rep.KuwaitKyrgyz RepublicLao PDRLatviaLebanonLesothoLiberiaLibyaLithuaniaLuxembourgMacao SAR, ChinaMacedonia, FYRMadagascarMalawiMalaysiaMaldivesMaliMauritaniaMauritiusMexicoMicronesia, Fed. Sts.MoldovaMongoliaMoroccoMozambiqueMyanmarNamibiaNepalNetherlandsNew CaledoniaNew ZealandNicaraguaNigerNigeriaNorwayOmanPakistanPanamaPapua New GuineaParaguayPeruPhilippinesPolandPortugalQatarRomaniaRussian FederationRwandaSamoaSao Tome and PrincipeSaudi ArabiaSenegalSeychellesSierra LeoneSingaporeSlovak RepublicSloveniaSolomon IslandsSomaliaSouth AfricaSpainSri LankaSt. LuciaSt. Vincent and the GrenadinesSudanSurinameSwazilandSwedenSwitzerlandSyrian Arab RepublicTajikistanTanzaniaThailandTogoTongaTrinidad and TobagoTunisiaTurkeyTurkmenistanUgandaUkraineUnited Arab EmiratesUnited KingdomUnited StatesUruguayUzbekistanVanuatuVenezuela, RBVietnamYemen, Rep.ZambiaZimbabwe La ligne de temps
Cette échelle de temps montre un graphique de 1971 année à 2015 année Ethiopia. Les données jusqu'à 1970 année ne sont pas présentés. Quantité d'observations actuelles selon dates: 45.
Source (désignation):
Les indicateurs du développement mondiale
Source (organisation):
World Bank staff estimates based on sources and methods in World Bank's "The Changing Wealth of Nations: Measuring Sustainable Development in the New Millennium" (2011).
Catégories:
Economy & Growth, Environment
Dernière mise à jour
23 avr. 2017
Les indicateurs de changement de valeurs selon les années
Minimum:
93.712 mln.
1 janv. 1972
Maximum:
5.903 mds
1 janv. 2015
Pour la date d''observation
Valeur
Changement absolu
Le changement par rapport à la valeur précédente
1 janv. 1971
106.831 mln.
+106.831 mln.
0.0%
1 janv. 1972
93.712 mln.
-13.119 mln.
-12.28%
1 janv. 1973
111.254 mln.
+17.542 mln.
18.72%
1 janv. 1974
206.717 mln.
+95.463 mln.
85.81%
1 janv. 1975
225.251 mln.
+18.534 mln.
8.97%
1 janv. 1976
316.947 mln.
+91.695 mln.
40.71%
1 janv. 1977
302.949 mln.
-13.998 mln.
-4.42%
1 janv. 1978
458.338 mln.
+155.389 mln.
51.29%
1 janv. 1979
453.581 mln.
-4.757 mln.
-1.04%
1 janv. 1980
585.225 mln.
+131.644 mln.
29.02%
1 janv. 1981
766.858 mln.
+181.633 mln.
31.04%
1 janv. 1982
633.106 mln.
-133.751 mln.
-17.44%
1 janv. 1983
952.754 mln.
+319.648 mln.
50.49%
1 janv. 1984
610.42 mln.
-342.334 mln.
-35.93%
1 janv. 1985
589.474 mln.
-20.946 mln.
-3.43%
1 janv. 1986
440.727 mln.
-148.747 mln.
-25.23%
1 janv. 1987
722.451 mln.
+281.724 mln.
63.92%
1 janv. 1988
698.815 mln.
-23.636 mln.
-3.27%
1 janv. 1989
811.679 mln.
+112.864 mln.
16.15%
1 janv. 1990
802.203 mln.
-9.475 mln.
-1.17%
1 janv. 1991
1.13 mds
+328.086 mln.
40.9%
1 janv. 1992
1.213 mds
+82.315 mln.
7.28%
1 janv. 1993
1.281 mds
+68.749 mln.
5.67%
1 janv. 1994
1.002 mds
-279.111 mln.
-21.78%
1 janv. 1995
1.297 mds
+294.259 mln.
29.36%
1 janv. 1996
2.002 mds
+705.308 mln.
54.4%
1 janv. 1997
2.029 mds
+27.376 mln.
1.37%
1 janv. 1998
1.937 mds
-91.728 mln.
-4.52%
1 janv. 1999
2.044 mds
+106.46 mln.
5.49%
1 janv. 2000
1.269 mds
-775.282 mln.
-37.93%
1 janv. 2001
1.284 mds
+15.135 mln.
1.19%
1 janv. 2002
1.262 mds
-21.539 mln.
-1.68%
1 janv. 2003
1.545 mds
+283.058 mln.
22.43%
1 janv. 2004
2.677 mds
+1.132 mds
73.26%
1 janv. 2005
2.429 mds
-248.594 mln.
-9.29%
1 janv. 2006
2.491 mds
+62.206 mln.
2.56%
1 janv. 2007
2.485 mds
-5.83 mln.
-0.23%
1 janv. 2008
3.746 mds
+1.261 mds
50.74%
1 janv. 2009
4.433 mds
+686.98 mln.
18.34%
1 janv. 2010
4.647 mds
+214.07 mln.
4.83%
1 janv. 2011
4.096 mds
-551.515 mln.
-11.87%
1 janv. 2012
4.697 mds
+601.173 mln.
14.68%
1 janv. 2013
5.495 mds
+798.542 mln.
17.0%
1 janv. 2014
5.73 mds
+235.038 mln.
4.28%
1 janv. 2015
5.903 mds
+172.885 mln.
3.02%
Classement des pays selon les statistiques actuelles par années


Commentaires: