29
/fr/
fr
AIzaSyAYiBZKx7MnpbEhh9jyipgxe19OcubqV5w
April 1, 2024
263890
Timor-Leste
TLS
true
2
1
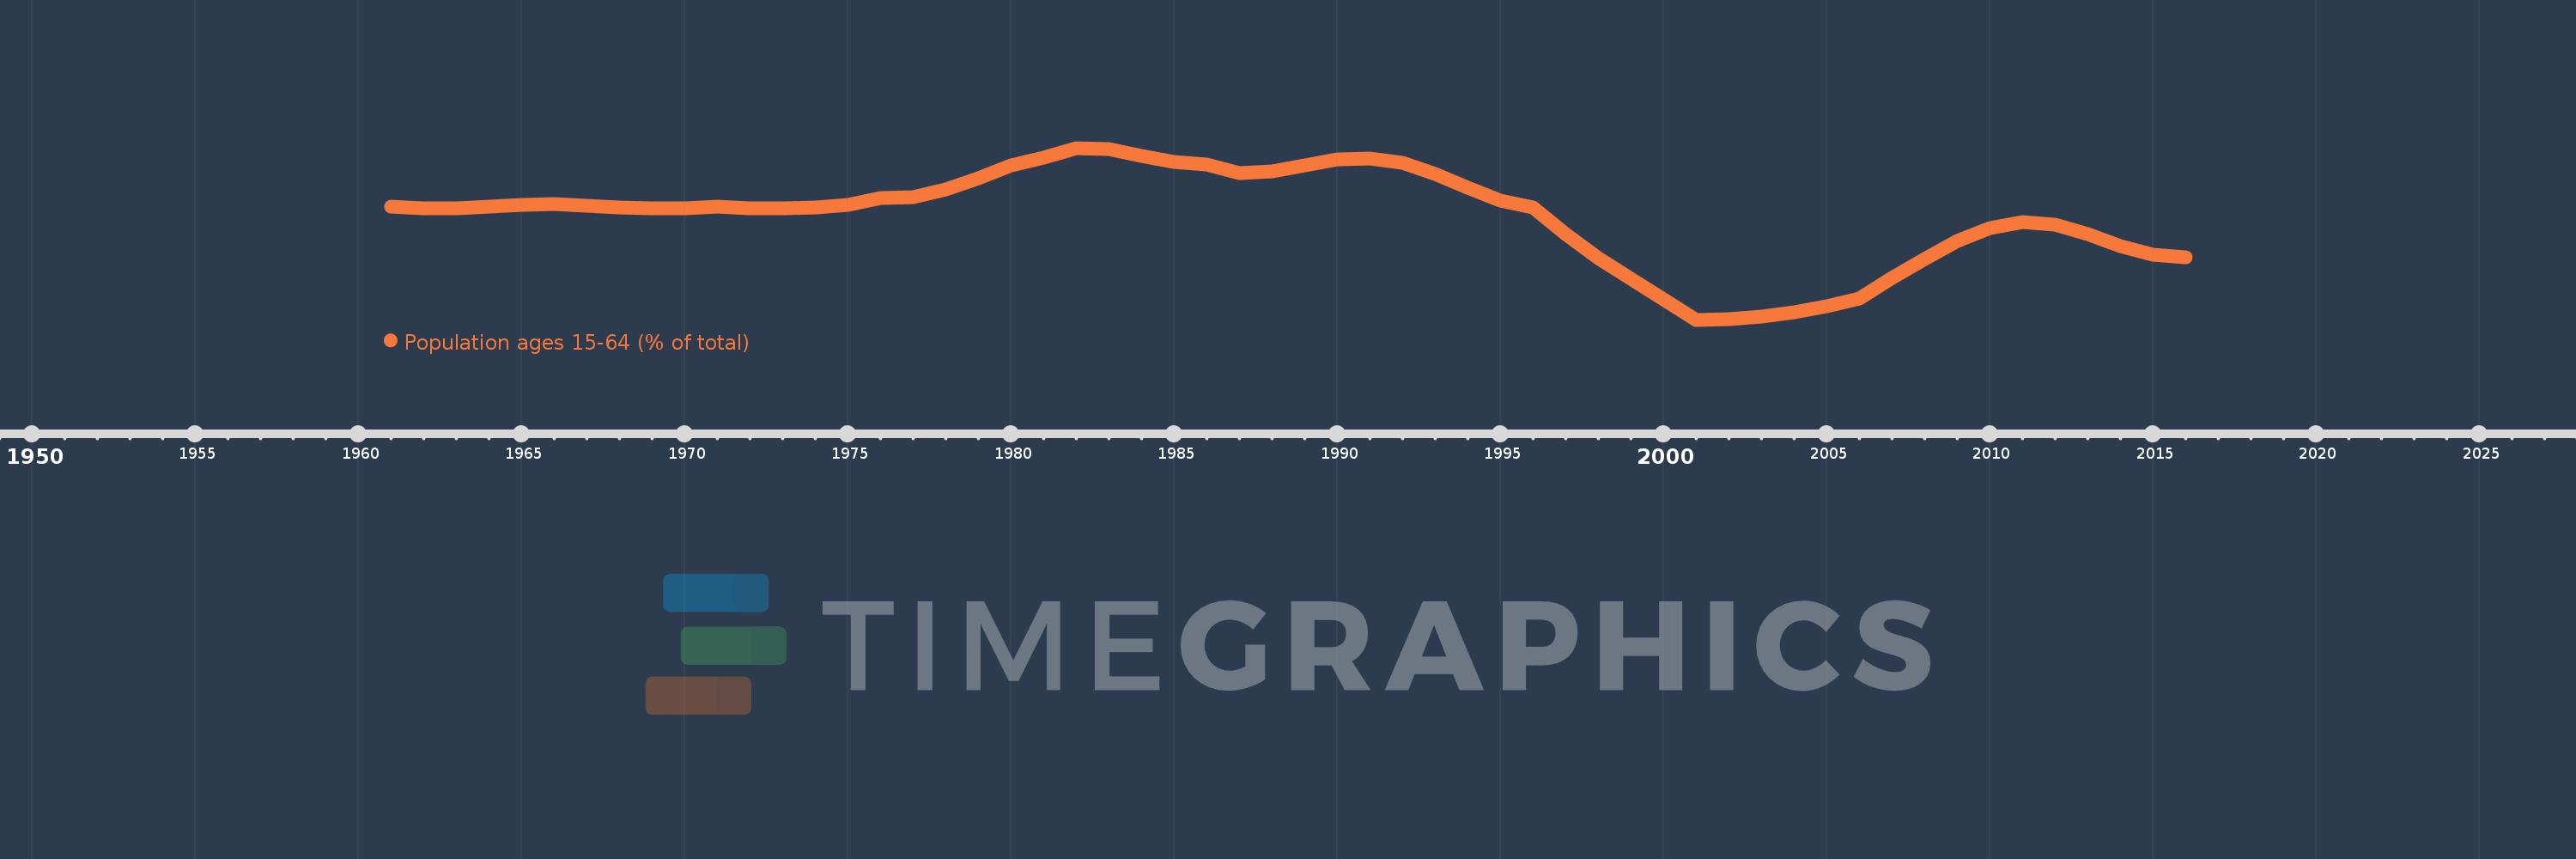
Population ages 15-64 (% of total)
2016,2015,2014,2013,2012,2011,2010,2009,2008,2007,2006,2005,2004,2003,2002,2001,2000,1999,1998,1997,1996,1995,1994,1993,1992,1991,1990,1989,1988,1987,1986,1985,1984,1983,1982,1981,1980,1979,1978,1977,1976,1975,1974,1973,1972,1971,1970,1969,1968,1967,1966,1965,1964,1963,1962,1961
Cette statistique dans les autres pays:
AfghanistanAlbaniaAlgeriaAngolaAntigua and BarbudaArab WorldArgentinaArmeniaArubaAustraliaAustriaAzerbaijanBahamas, TheBahrainBangladeshBarbadosBelarusBelgiumBelizeBeninBhutanBoliviaBosnia and HerzegovinaBotswanaBrazilBrunei DarussalamBulgariaBurkina FasoBurundiCabo VerdeCambodiaCameroonCanadaCaribbean small statesCentral African RepublicCentral Europe and the BalticsChadChannel IslandsChileChinaColombiaComorosCongo, Dem. Rep.Congo, Rep.Costa RicaCote d'IvoireCroatiaCubaCuracaoCyprusCzech RepublicDenmarkDjiboutiDominican RepublicEarly-demographic dividendEast Asia & PacificEast Asia & Pacific (excluding high income)East Asia & Pacific (IDA & IBRD countries)EcuadorEgypt, Arab Rep.El SalvadorEquatorial GuineaEritreaEstoniaEthiopiaEuro areaEurope & Central AsiaEurope & Central Asia (excluding high income)Europe & Central Asia (IDA & IBRD countries)European UnionFijiFinlandFragile and conflict affected situationsFranceFrench PolynesiaGabonGambia, TheGeorgiaGermanyGhanaGreeceGrenadaGuamGuatemalaGuineaGuinea-BissauGuyanaHaitiHeavily indebted poor countries (HIPC)High incomeHondurasHong Kong SAR, ChinaHungaryIBRD onlyIcelandIDA & IBRD totalIDA blendIDA onlyIDA totalIndiaIndonesiaIran, Islamic Rep.IraqIrelandIsraelItalyJamaicaJapanJordanKazakhstanKenyaKiribatiKorea, Dem. People’s Rep.Korea, Rep.KosovoKuwaitKyrgyz RepublicLao PDRLate-demographic dividendLatin America & Caribbean Latin America & Caribbean (excluding high income)Latin America & the Caribbean (IDA & IBRD countries)LatviaLeast developed countries: UN classificationLebanonLesothoLiberiaLibyaLithuaniaLow & middle incomeLow incomeLower middle incomeLuxembourgMacao SAR, ChinaMacedonia, FYRMadagascarMalawiMalaysiaMaldivesMaliMaltaMauritaniaMauritiusMexicoMicronesia, Fed. Sts.Middle East & North AfricaMiddle East & North Africa (excluding high income)Middle East & North Africa (IDA & IBRD countries)Middle incomeMoldovaMongoliaMontenegroMoroccoMozambiqueMyanmarNamibiaNepalNetherlandsNew CaledoniaNew ZealandNicaraguaNigerNigeriaNorth AmericaNorwayOECD membersOmanOther small statesPacific island small statesPakistanPanamaPapua New GuineaParaguayPeruPhilippinesPolandPortugalPost-demographic dividendPre-demographic dividendPuerto RicoQatarRomaniaRussian FederationRwandaSamoaSao Tome and PrincipeSaudi ArabiaSenegalSerbiaSeychellesSierra LeoneSingaporeSlovak RepublicSloveniaSmall statesSolomon IslandsSomaliaSouth AfricaSouth AsiaSouth Asia (IDA & IBRD)South SudanSpainSri LankaSt. LuciaSt. Vincent and the GrenadinesSub-Saharan Africa Sub-Saharan Africa (excluding high income)Sub-Saharan Africa (IDA & IBRD countries)SudanSurinameSwazilandSwedenSwitzerlandSyrian Arab RepublicTajikistanTanzaniaThailandTimor-LesteTogoTongaTrinidad and TobagoTunisiaTurkeyTurkmenistanUgandaUkraineUnited Arab EmiratesUnited KingdomUnited StatesUpper middle incomeUruguayUzbekistanVanuatuVenezuela, RBVietnamVirgin Islands (U.S.)West Bank and GazaWorldYemen, Rep.ZambiaZimbabwe La ligne de temps
Cette échelle de temps montre un graphique de 1961 année à 2016 année Timor-Leste. Les données jusqu'à 1960 année ne sont pas présentés. Quantité d'observations actuelles selon dates: 56.
Source (désignation):
Les indicateurs du développement mondiale
Source (organisation):
World Bank staff estimates based on age distributions of United Nations Population Division's World Population Prospects.
Catégories:
Education, Health
Dernière mise à jour
23 avr. 2017
Les indicateurs de changement de valeurs selon les années
Minimum:
47.709
1 janv. 2001
Maximum:
59.57
1 janv. 1982
Pour la date d''observation
Valeur
Changement absolu
Le changement par rapport à la valeur précédente
1 janv. 1961
55.52
+55.52
0.0%
1 janv. 1962
55.411
-0.109
-0.2%
1 janv. 1963
55.423
+0.012
0.02%
1 janv. 1964
55.512
+0.089
0.16%
1 janv. 1965
55.613
+0.101
0.18%
1 janv. 1966
55.695
+0.082
0.15%
1 janv. 1967
55.558
-0.138
-0.25%
1 janv. 1968
55.465
-0.093
-0.17%
1 janv. 1969
55.419
-0.046
-0.08%
1 janv. 1970
55.429
+0.01
0.02%
1 janv. 1971
55.497
+0.067
0.12%
1 janv. 1972
55.417
-0.08
-0.14%
1 janv. 1973
55.394
-0.023
-0.04%
1 janv. 1974
55.447
+0.053
0.1%
1 janv. 1975
55.664
+0.217
0.39%
1 janv. 1976
56.137
+0.473
0.85%
1 janv. 1977
56.201
+0.063
0.11%
1 janv. 1978
56.685
+0.484
0.86%
1 janv. 1979
57.5
+0.816
1.44%
1 janv. 1980
58.352
+0.852
1.48%
1 janv. 1981
58.927
+0.574
0.98%
1 janv. 1982
59.57
+0.644
1.09%
1 janv. 1983
59.521
-0.049
-0.08%
1 janv. 1984
59.039
-0.482
-0.81%
1 janv. 1985
58.592
-0.447
-0.76%
1 janv. 1986
58.442
-0.15
-0.26%
1 janv. 1987
57.847
-0.596
-1.02%
1 janv. 1988
57.922
+0.075
0.13%
1 janv. 1989
58.392
+0.47
0.81%
1 janv. 1990
58.78
+0.388
0.66%
1 janv. 1991
58.812
+0.032
0.06%
1 janv. 1992
58.521
-0.292
-0.5%
1 janv. 1993
57.769
-0.752
-1.28%
1 janv. 1994
56.795
-0.974
-1.69%
1 janv. 1995
55.961
-0.834
-1.47%
1 janv. 1996
55.432
-0.529
-0.94%
1 janv. 1997
53.606
-1.826
-3.29%
1 janv. 1998
51.985
-1.621
-3.02%
1 janv. 1999
50.531
-1.454
-2.8%
1 janv. 2000
49.127
-1.404
-2.78%
1 janv. 2001
47.709
-1.418
-2.89%
1 janv. 2002
47.742
+0.033
0.07%
1 janv. 2003
47.921
+0.179
0.38%
1 janv. 2004
48.215
+0.294
0.61%
1 janv. 2005
48.625
+0.41
0.85%
1 janv. 2006
49.164
+0.54
1.11%
1 janv. 2007
50.586
+1.422
2.89%
1 janv. 2008
51.93
+1.343
2.66%
1 janv. 2009
53.126
+1.196
2.3%
1 janv. 2010
54.02
+0.894
1.68%
1 janv. 2011
54.454
+0.434
0.8%
1 janv. 2012
54.274
-0.179
-0.33%
1 janv. 2013
53.625
-0.65
-1.2%
1 janv. 2014
52.814
-0.811
-1.51%
1 janv. 2015
52.221
-0.593
-1.12%
1 janv. 2016
52.009
-0.212
-0.41%
Classement des pays selon les statistiques actuelles par années


Commentaires: