29
/fr/
fr
AIzaSyAYiBZKx7MnpbEhh9jyipgxe19OcubqV5w
April 1, 2024
166651
Kazakhstan
KAZ
true
2
1
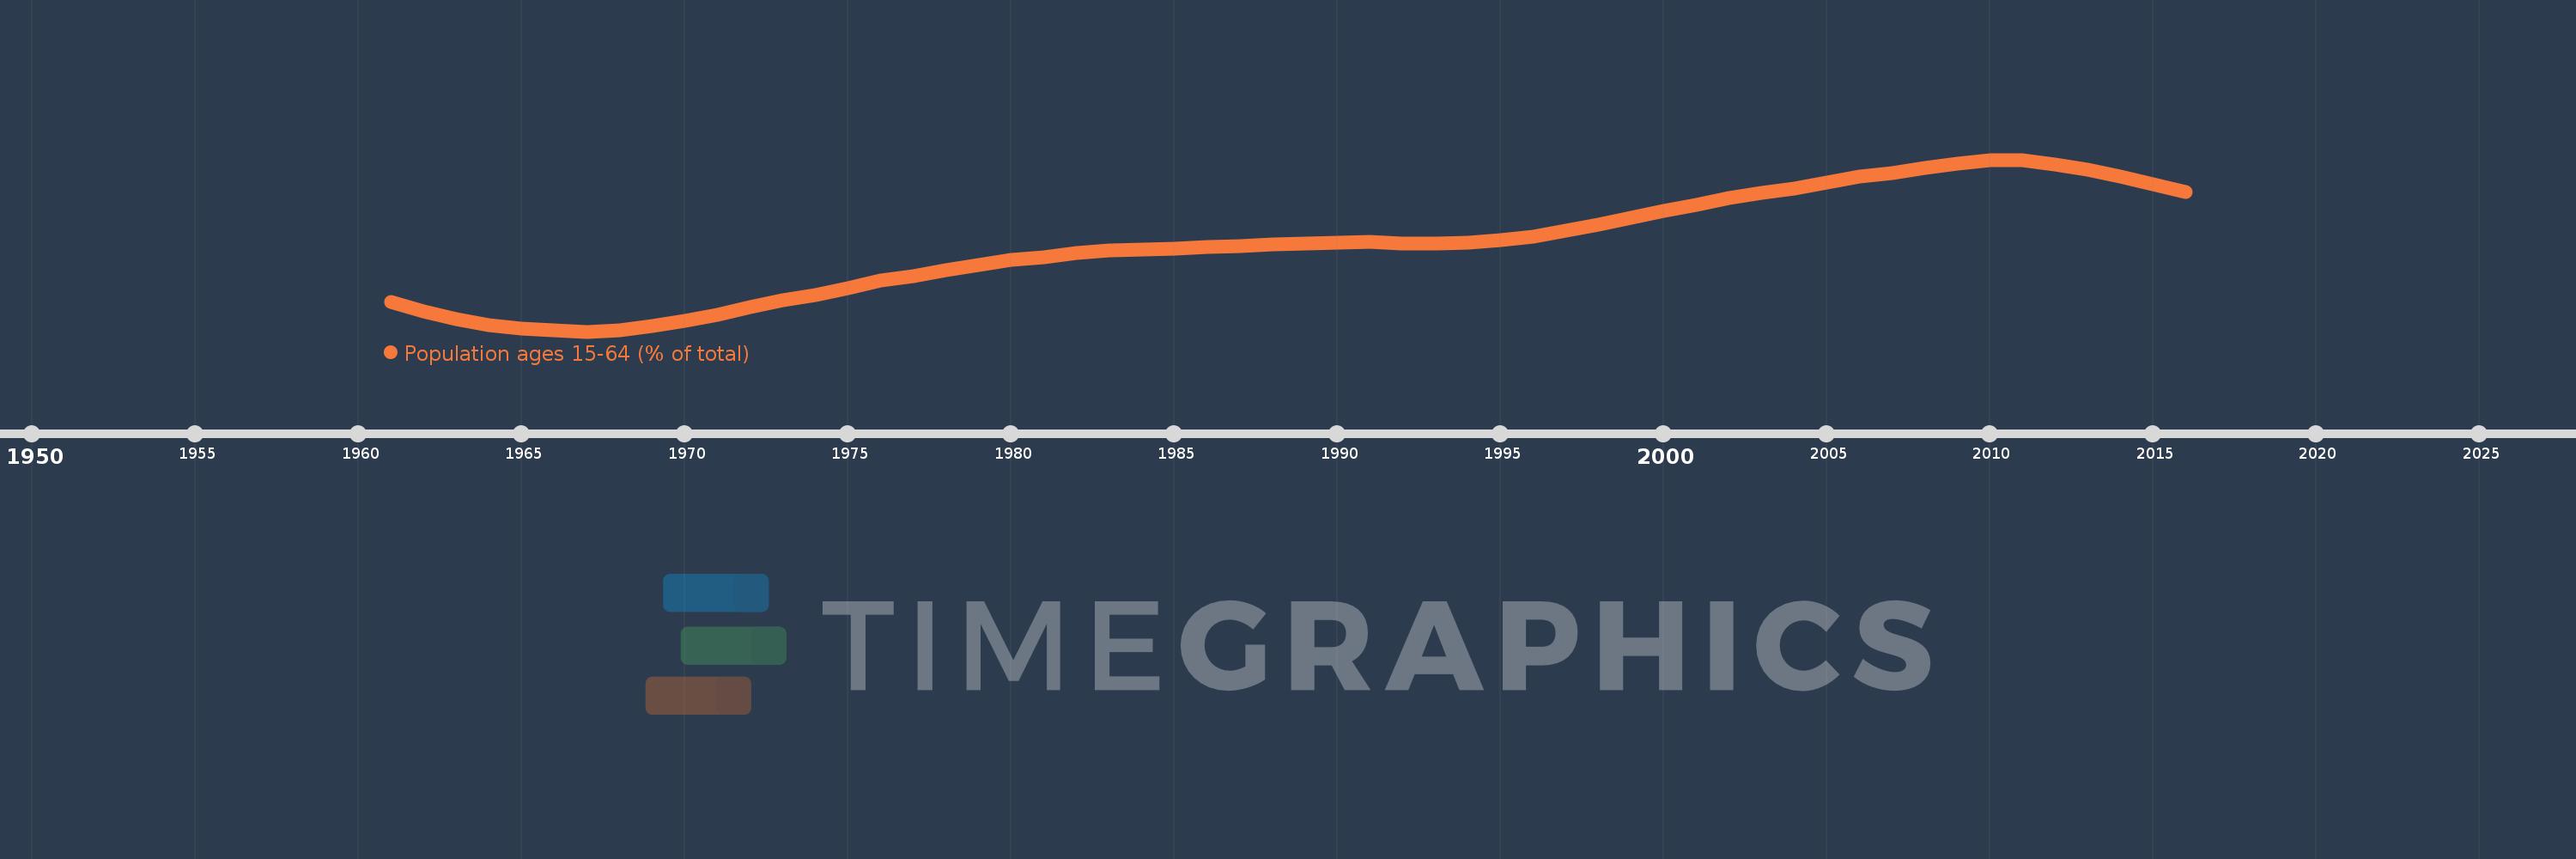
Population ages 15-64 (% of total)
2016,2015,2014,2013,2012,2011,2010,2009,2008,2007,2006,2005,2004,2003,2002,2001,2000,1999,1998,1997,1996,1995,1994,1993,1992,1991,1990,1989,1988,1987,1986,1985,1984,1983,1982,1981,1980,1979,1978,1977,1976,1975,1974,1973,1972,1971,1970,1969,1968,1967,1966,1965,1964,1963,1962,1961
Cette statistique dans les autres pays:
AfghanistanAlbaniaAlgeriaAngolaAntigua and BarbudaArab WorldArgentinaArmeniaArubaAustraliaAustriaAzerbaijanBahamas, TheBahrainBangladeshBarbadosBelarusBelgiumBelizeBeninBhutanBoliviaBosnia and HerzegovinaBotswanaBrazilBrunei DarussalamBulgariaBurkina FasoBurundiCabo VerdeCambodiaCameroonCanadaCaribbean small statesCentral African RepublicCentral Europe and the BalticsChadChannel IslandsChileChinaColombiaComorosCongo, Dem. Rep.Congo, Rep.Costa RicaCote d'IvoireCroatiaCubaCuracaoCyprusCzech RepublicDenmarkDjiboutiDominican RepublicEarly-demographic dividendEast Asia & PacificEast Asia & Pacific (excluding high income)East Asia & Pacific (IDA & IBRD countries)EcuadorEgypt, Arab Rep.El SalvadorEquatorial GuineaEritreaEstoniaEthiopiaEuro areaEurope & Central AsiaEurope & Central Asia (excluding high income)Europe & Central Asia (IDA & IBRD countries)European UnionFijiFinlandFragile and conflict affected situationsFranceFrench PolynesiaGabonGambia, TheGeorgiaGermanyGhanaGreeceGrenadaGuamGuatemalaGuineaGuinea-BissauGuyanaHaitiHeavily indebted poor countries (HIPC)High incomeHondurasHong Kong SAR, ChinaHungaryIBRD onlyIcelandIDA & IBRD totalIDA blendIDA onlyIDA totalIndiaIndonesiaIran, Islamic Rep.IraqIrelandIsraelItalyJamaicaJapanJordanKazakhstanKenyaKiribatiKorea, Dem. People’s Rep.Korea, Rep.KosovoKuwaitKyrgyz RepublicLao PDRLate-demographic dividendLatin America & Caribbean Latin America & Caribbean (excluding high income)Latin America & the Caribbean (IDA & IBRD countries)LatviaLeast developed countries: UN classificationLebanonLesothoLiberiaLibyaLithuaniaLow & middle incomeLow incomeLower middle incomeLuxembourgMacao SAR, ChinaMacedonia, FYRMadagascarMalawiMalaysiaMaldivesMaliMaltaMauritaniaMauritiusMexicoMicronesia, Fed. Sts.Middle East & North AfricaMiddle East & North Africa (excluding high income)Middle East & North Africa (IDA & IBRD countries)Middle incomeMoldovaMongoliaMontenegroMoroccoMozambiqueMyanmarNamibiaNepalNetherlandsNew CaledoniaNew ZealandNicaraguaNigerNigeriaNorth AmericaNorwayOECD membersOmanOther small statesPacific island small statesPakistanPanamaPapua New GuineaParaguayPeruPhilippinesPolandPortugalPost-demographic dividendPre-demographic dividendPuerto RicoQatarRomaniaRussian FederationRwandaSamoaSao Tome and PrincipeSaudi ArabiaSenegalSerbiaSeychellesSierra LeoneSingaporeSlovak RepublicSloveniaSmall statesSolomon IslandsSomaliaSouth AfricaSouth AsiaSouth Asia (IDA & IBRD)South SudanSpainSri LankaSt. LuciaSt. Vincent and the GrenadinesSub-Saharan Africa Sub-Saharan Africa (excluding high income)Sub-Saharan Africa (IDA & IBRD countries)SudanSurinameSwazilandSwedenSwitzerlandSyrian Arab RepublicTajikistanTanzaniaThailandTimor-LesteTogoTongaTrinidad and TobagoTunisiaTurkeyTurkmenistanUgandaUkraineUnited Arab EmiratesUnited KingdomUnited StatesUpper middle incomeUruguayUzbekistanVanuatuVenezuela, RBVietnamVirgin Islands (U.S.)West Bank and GazaWorldYemen, Rep.ZambiaZimbabwe La ligne de temps
Cette échelle de temps montre un graphique de 1961 année à 2016 année Kazakhstan. Les données jusqu'à 1960 année ne sont pas présentés. Quantité d'observations actuelles selon dates: 56.
Source (désignation):
Les indicateurs du développement mondiale
Source (organisation):
World Bank staff estimates based on age distributions of United Nations Population Division's World Population Prospects.
Catégories:
Education, Health
Dernière mise à jour
23 avr. 2017
Les indicateurs de changement de valeurs selon les années
Minimum:
55.772
1 janv. 1967
Maximum:
69.021
1 janv. 2011
Pour la date d''observation
Valeur
Changement absolu
Le changement par rapport à la valeur précédente
1 janv. 1961
58.063
+58.063
0.0%
1 janv. 1962
57.333
-0.73
-1.26%
1 janv. 1963
56.728
-0.605
-1.06%
1 janv. 1964
56.273
-0.455
-0.8%
1 janv. 1965
55.981
-0.292
-0.52%
1 janv. 1966
55.873
-0.108
-0.19%
1 janv. 1967
55.772
-0.101
-0.18%
1 janv. 1968
55.902
+0.13
0.23%
1 janv. 1969
56.215
+0.313
0.56%
1 janv. 1970
56.616
+0.402
0.71%
1 janv. 1971
57.045
+0.429
0.76%
1 janv. 1972
57.663
+0.618
1.08%
1 janv. 1973
58.163
+0.5
0.87%
1 janv. 1974
58.608
+0.445
0.76%
1 janv. 1975
59.106
+0.498
0.85%
1 janv. 1976
59.7
+0.594
1.0%
1 janv. 1977
60.04
+0.34
0.57%
1 janv. 1978
60.477
+0.437
0.73%
1 janv. 1979
60.928
+0.451
0.75%
1 janv. 1980
61.28
+0.353
0.58%
1 janv. 1981
61.504
+0.223
0.36%
1 janv. 1982
61.814
+0.311
0.51%
1 janv. 1983
62.011
+0.196
0.32%
1 janv. 1984
62.114
+0.103
0.17%
1 janv. 1985
62.19
+0.076
0.12%
1 janv. 1986
62.282
+0.092
0.15%
1 janv. 1987
62.389
+0.106
0.17%
1 janv. 1988
62.483
+0.094
0.15%
1 janv. 1989
62.557
+0.074
0.12%
1 janv. 1990
62.612
+0.055
0.09%
1 janv. 1991
62.678
+0.066
0.11%
1 janv. 1992
62.551
-0.127
-0.2%
1 janv. 1993
62.537
-0.014
-0.02%
1 janv. 1994
62.624
+0.088
0.14%
1 janv. 1995
62.805
+0.18
0.29%
1 janv. 1996
63.076
+0.271
0.43%
1 janv. 1997
63.527
+0.451
0.71%
1 janv. 1998
64.04
+0.513
0.81%
1 janv. 1999
64.579
+0.539
0.84%
1 janv. 2000
65.093
+0.514
0.8%
1 janv. 2001
65.536
+0.444
0.68%
1 janv. 2002
66.049
+0.513
0.78%
1 janv. 2003
66.458
+0.409
0.62%
1 janv. 2004
66.833
+0.375
0.56%
1 janv. 2005
67.244
+0.41
0.61%
1 janv. 2006
67.704
+0.461
0.68%
1 janv. 2007
68.011
+0.307
0.45%
1 janv. 2008
68.366
+0.355
0.52%
1 janv. 2009
68.712
+0.347
0.51%
1 janv. 2010
68.955
+0.242
0.35%
1 janv. 2011
69.021
+0.066
0.1%
1 janv. 2012
68.672
-0.349
-0.51%
1 janv. 2013
68.233
-0.439
-0.64%
1 janv. 2014
67.711
-0.522
-0.77%
1 janv. 2015
67.137
-0.574
-0.85%
1 janv. 2016
66.547
-0.59
-0.88%
Classement des pays selon les statistiques actuelles par années


Commentaires: