29
/fr/
fr
AIzaSyAYiBZKx7MnpbEhh9jyipgxe19OcubqV5w
April 1, 2024
260264
Tajikistan
TJK
true
2
1
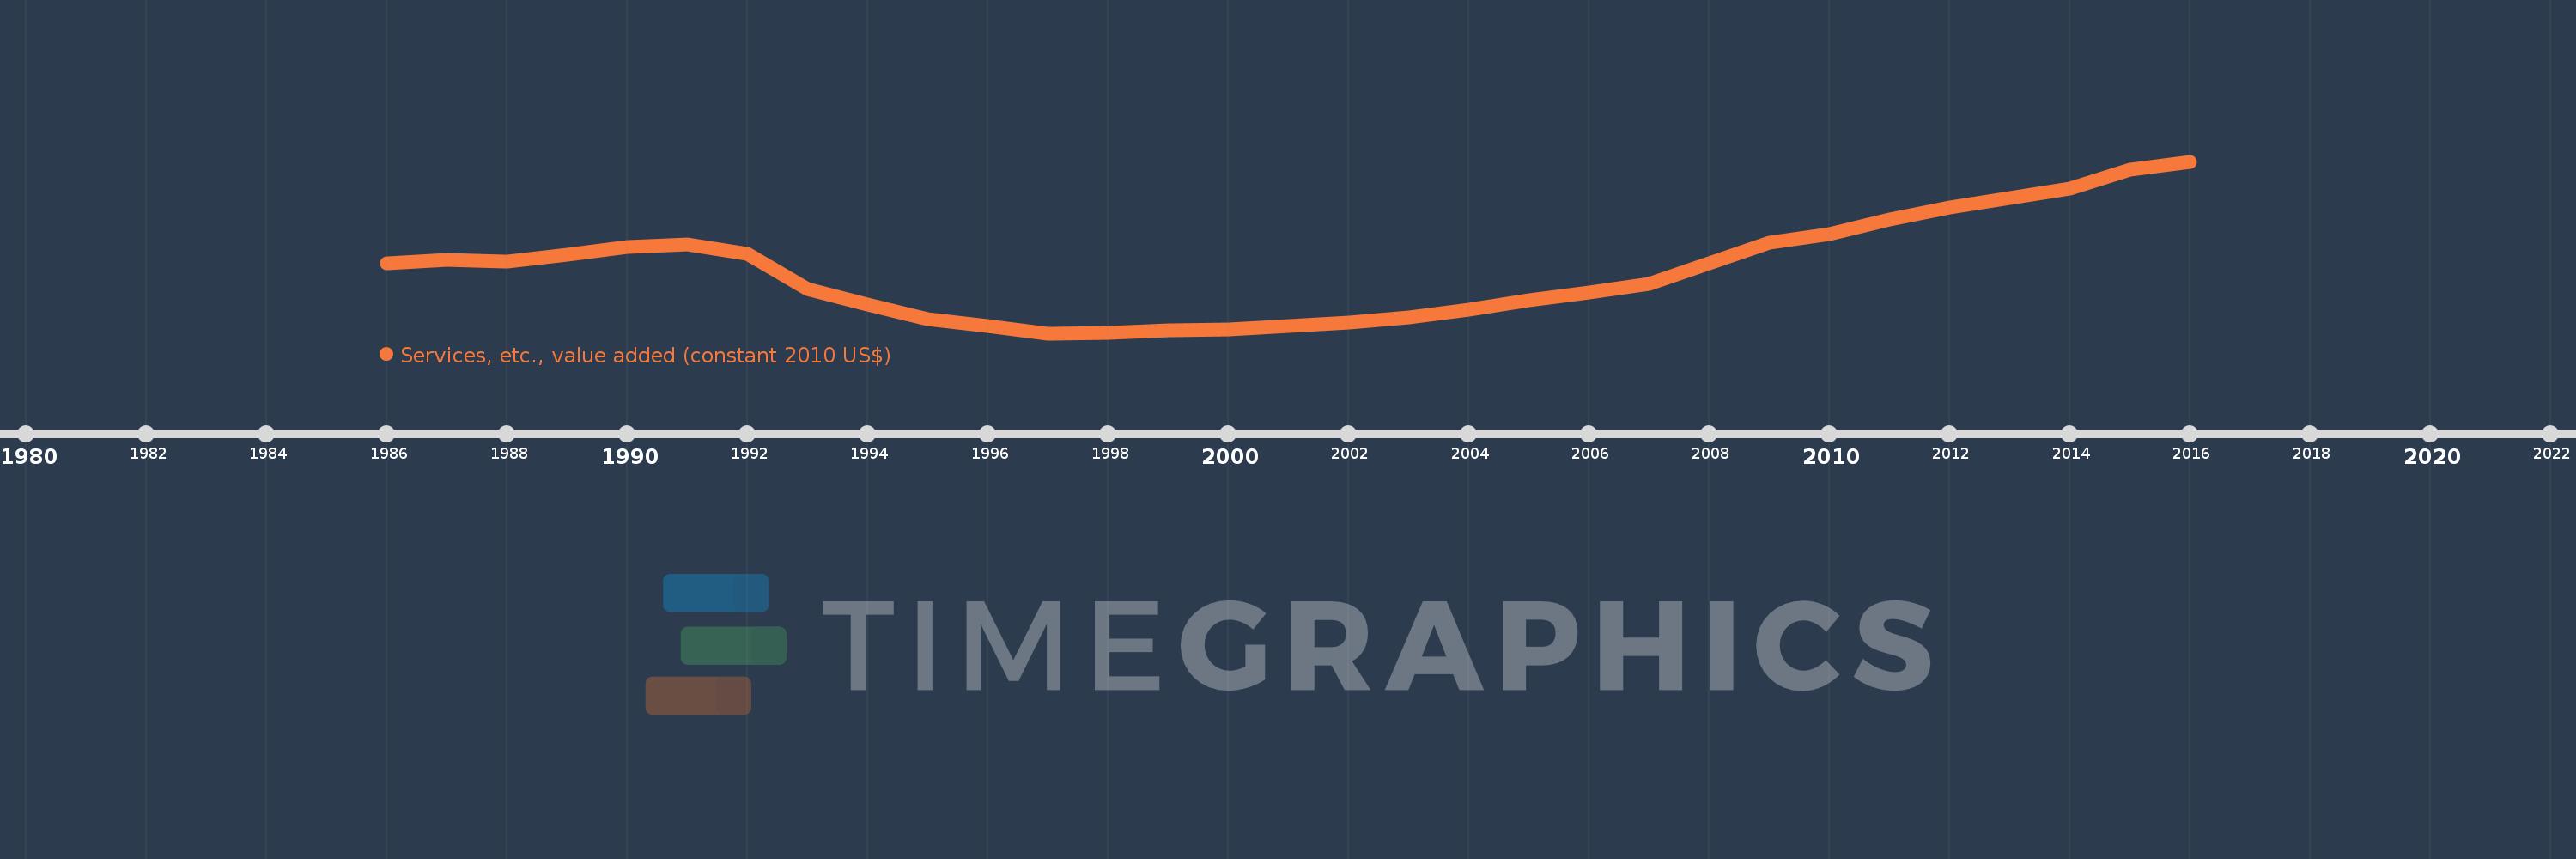
Services, etc., value added (constant 2010 US$)
2016,2015,2014,2013,2012,2011,2010,2009,2008,2007,2006,2005,2004,2003,2002,2001,2000,1999,1998,1997,1996,1995,1994,1993,1992,1991,1990,1989,1988,1987,1986
Cette statistique dans les autres pays:
AfghanistanAlbaniaAlgeriaAndorraAntigua and BarbudaArab WorldArgentinaArmeniaArubaAustraliaAustriaAzerbaijanBahamas, TheBahrainBangladeshBarbadosBelarusBelgiumBelizeBeninBermudaBhutanBoliviaBosnia and HerzegovinaBotswanaBrazilBrunei DarussalamBulgariaBurkina FasoBurundiCabo VerdeCambodiaCameroonCanadaCaribbean small statesCentral African RepublicCentral Europe and the BalticsChadChileChinaColombiaComorosCongo, Dem. Rep.Congo, Rep.Costa RicaCote d'IvoireCroatiaCubaCyprusCzech RepublicDenmarkDominicaDominican RepublicEarly-demographic dividendEast Asia & PacificEast Asia & Pacific (excluding high income)East Asia & Pacific (IDA & IBRD countries)EcuadorEgypt, Arab Rep.El SalvadorEquatorial GuineaEstoniaEthiopiaEuro areaEurope & Central AsiaEurope & Central Asia (excluding high income)Europe & Central Asia (IDA & IBRD countries)European UnionFaroe IslandsFijiFinlandFragile and conflict affected situationsFranceGabonGambia, TheGeorgiaGermanyGhanaGreeceGrenadaGuatemalaGuineaGuinea-BissauGuyanaHeavily indebted poor countries (HIPC)High incomeHondurasHong Kong SAR, ChinaHungaryIBRD onlyIcelandIDA & IBRD totalIDA blendIDA onlyIDA totalIndiaIndonesiaIran, Islamic Rep.IraqIrelandItalyJamaicaJapanJordanKazakhstanKenyaKiribatiKorea, Rep.KosovoKuwaitKyrgyz RepublicLao PDRLate-demographic dividendLatin America & Caribbean Latin America & Caribbean (excluding high income)Latin America & the Caribbean (IDA & IBRD countries)LatviaLeast developed countries: UN classificationLebanonLesothoLiberiaLithuaniaLow & middle incomeLow incomeLower middle incomeLuxembourgMacao SAR, ChinaMacedonia, FYRMadagascarMalawiMalaysiaMaldivesMaliMaltaMarshall IslandsMauritaniaMauritiusMexicoMicronesia, Fed. Sts.Middle East & North AfricaMiddle East & North Africa (excluding high income)Middle East & North Africa (IDA & IBRD countries)Middle incomeMoldovaMongoliaMontenegroMoroccoMozambiqueMyanmarNamibiaNepalNetherlandsNew ZealandNicaraguaNigerNigeriaNorth AmericaNorwayOECD membersOmanOther small statesPacific island small statesPakistanPalauPanamaParaguayPeruPhilippinesPolandPortugalPost-demographic dividendPre-demographic dividendPuerto RicoQatarRomaniaRussian FederationRwandaSamoaSao Tome and PrincipeSaudi ArabiaSenegalSerbiaSeychellesSierra LeoneSingaporeSlovak RepublicSloveniaSmall statesSouth AfricaSouth AsiaSouth Asia (IDA & IBRD)SpainSri LankaSt. Kitts and NevisSt. LuciaSt. Vincent and the GrenadinesSub-Saharan Africa Sub-Saharan Africa (excluding high income)Sub-Saharan Africa (IDA & IBRD countries)SudanSurinameSwazilandSwedenSwitzerlandTajikistanTanzaniaThailandTimor-LesteTogoTongaTrinidad and TobagoTunisiaTurkeyTurkmenistanTuvaluUgandaUkraineUnited Arab EmiratesUnited KingdomUnited StatesUpper middle incomeUruguayUzbekistanVanuatuVenezuela, RBVietnamWest Bank and GazaWorldYemen, Rep.ZambiaZimbabwe La ligne de temps
Cette échelle de temps montre un graphique de 1986 année à 2016 année Tajikistan. Les données jusqu'à 1985 année ne sont pas présentés. Quantité d'observations actuelles selon dates: 31.
Source (désignation):
Les indicateurs du développement mondiale
Source (organisation):
World Bank national accounts data, and OECD National Accounts data files.
Catégories:
Economy & Growth
Dernière mise à jour
23 avr. 2017
Les indicateurs de changement de valeurs selon les années
Minimum:
637.334 mln.
1 janv. 1997
Maximum:
3.431 mds
1 janv. 2016
Pour la date d''observation
Valeur
Changement absolu
Le changement par rapport à la valeur précédente
1 janv. 1986
1.772 mds
+1.772 mds
0.0%
1 janv. 1987
1.832 mds
+60.246 mln.
3.4%
1 janv. 1988
1.81 mds
-21.986 mln.
-1.2%
1 janv. 1989
1.915 mds
+104.991 mln.
5.8%
1 janv. 1990
2.038 mds
+122.572 mln.
6.4%
1 janv. 1991
2.083 mds
+44.831 mln.
2.2%
1 janv. 1992
1.929 mds
-153.51 mln.
-7.37%
1 janv. 1993
1.364 mds
-565.405 mln.
-29.31%
1 janv. 1994
1.11 mds
-253.467 mln.
-18.59%
1 janv. 1995
861.983 mln.
-248.22 mln.
-22.36%
1 janv. 1996
757.807 mln.
-104.176 mln.
-12.09%
1 janv. 1997
637.334 mln.
-120.472 mln.
-15.9%
1 janv. 1998
649.131 mln.
+11.796 mln.
1.85%
1 janv. 1999
681.025 mln.
+31.894 mln.
4.91%
1 janv. 2000
705.452 mln.
+24.427 mln.
3.59%
1 janv. 2001
757.927 mln.
+52.476 mln.
7.44%
1 janv. 2002
818.084 mln.
+60.157 mln.
7.94%
1 janv. 2003
896.257 mln.
+78.173 mln.
9.56%
1 janv. 2004
1.018 mds
+121.463 mln.
13.55%
1 janv. 2005
1.172 mds
+154.761 mln.
15.21%
1 janv. 2006
1.3 mds
+127.533 mln.
10.88%
1 janv. 2007
1.442 mds
+142.034 mln.
10.93%
1 janv. 2008
1.782 mds
+339.973 mln.
23.58%
1 janv. 2009
2.116 mds
+334.087 mln.
18.75%
1 janv. 2010
2.249 mds
+132.659 mln.
6.27%
1 janv. 2011
2.489 mds
+240.683 mln.
10.7%
1 janv. 2012
2.684 mds
+194.888 mln.
7.83%
1 janv. 2013
2.841 mds
+156.402 mln.
5.83%
1 janv. 2014
2.991 mds
+150.521 mln.
5.3%
1 janv. 2015
3.293 mds
+302.135 mln.
10.1%
1 janv. 2016
3.431 mds
+137.735 mln.
4.18%
Classement des pays selon les statistiques actuelles par années


Commentaires: