29
/fr/
fr
AIzaSyAYiBZKx7MnpbEhh9jyipgxe19OcubqV5w
April 1, 2024
205838
Namibia
NAM
true
2
1
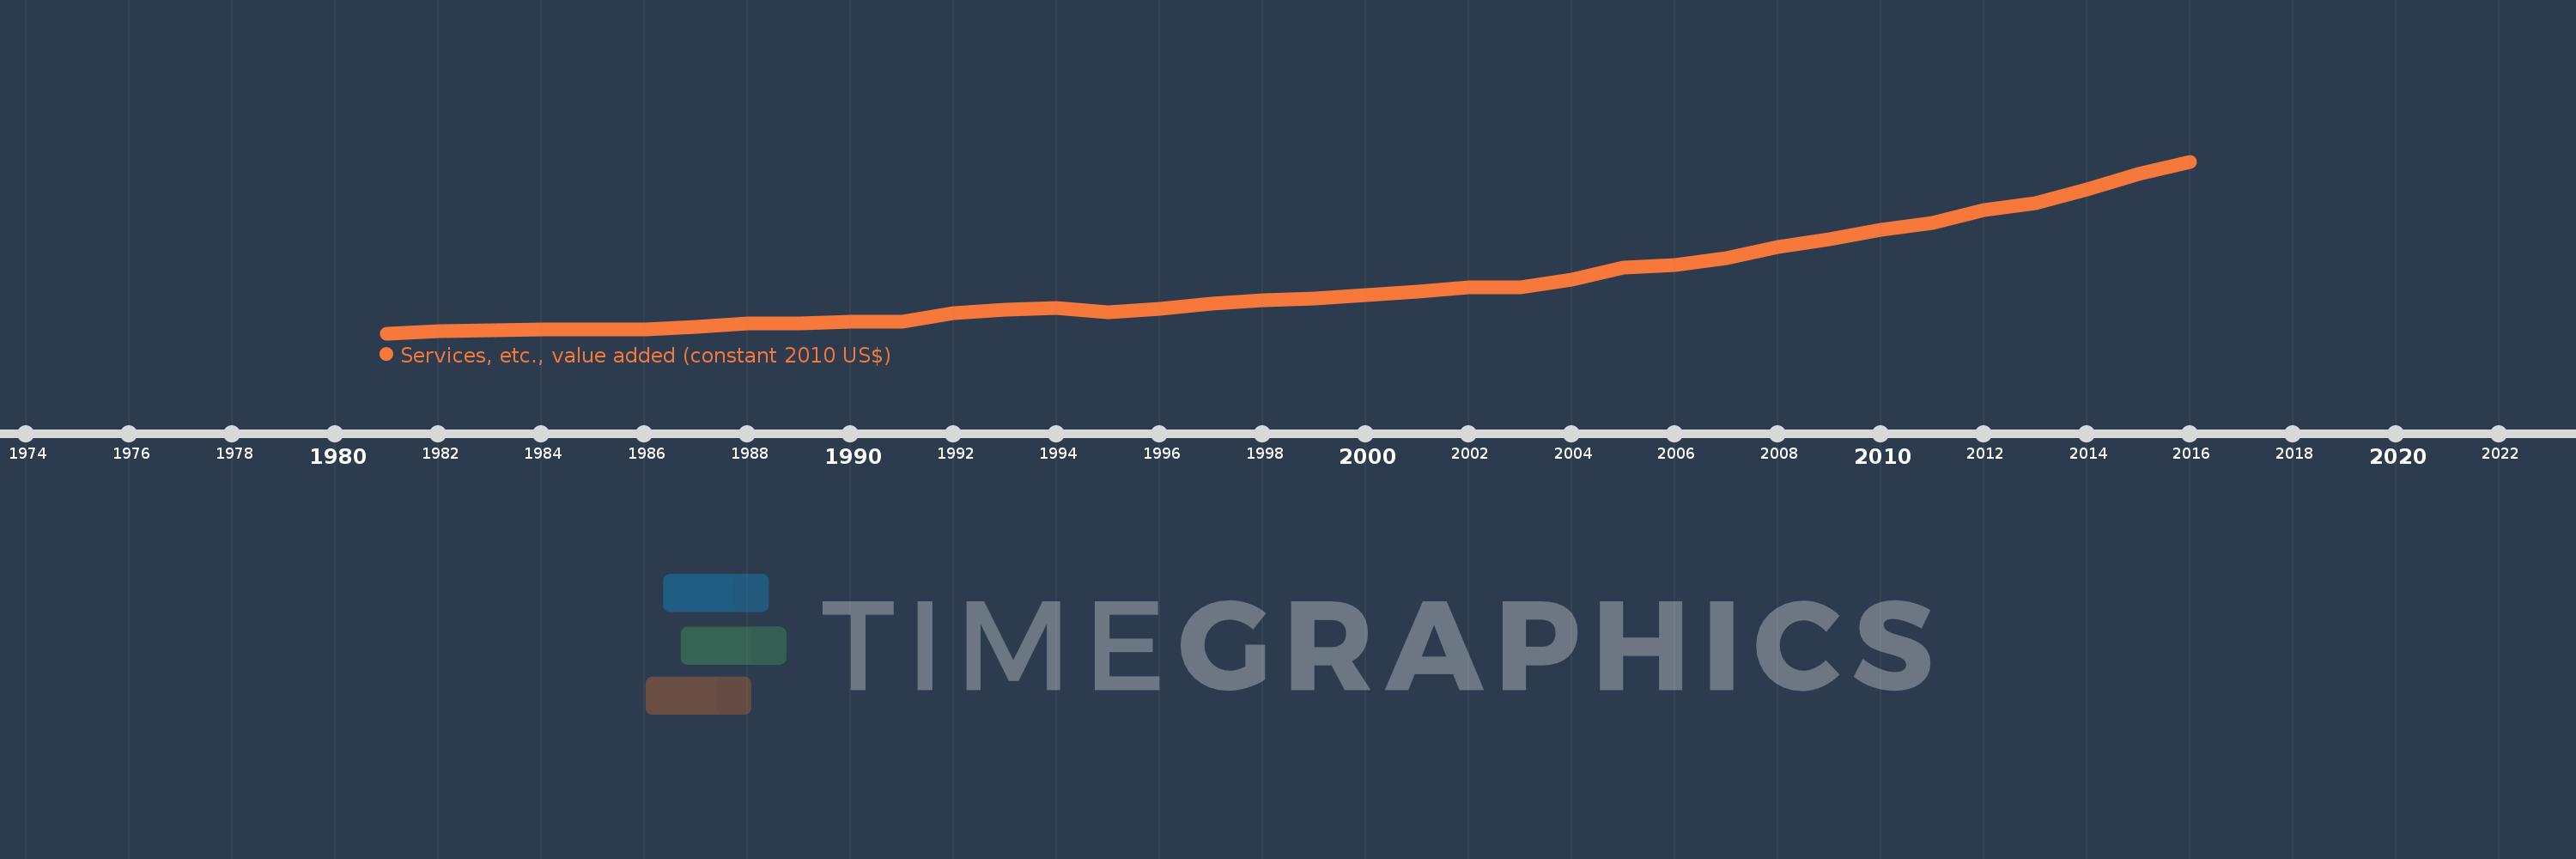
Services, etc., value added (constant 2010 US$)
2016,2015,2014,2013,2012,2011,2010,2009,2008,2007,2006,2005,2004,2003,2002,2001,2000,1999,1998,1997,1996,1995,1994,1993,1992,1991,1990,1989,1988,1987,1986,1985,1984,1983,1982,1981
Cette statistique dans les autres pays:
AfghanistanAlbaniaAlgeriaAndorraAntigua and BarbudaArab WorldArgentinaArmeniaArubaAustraliaAustriaAzerbaijanBahamas, TheBahrainBangladeshBarbadosBelarusBelgiumBelizeBeninBermudaBhutanBoliviaBosnia and HerzegovinaBotswanaBrazilBrunei DarussalamBulgariaBurkina FasoBurundiCabo VerdeCambodiaCameroonCanadaCaribbean small statesCentral African RepublicCentral Europe and the BalticsChadChileChinaColombiaComorosCongo, Dem. Rep.Congo, Rep.Costa RicaCote d'IvoireCroatiaCubaCyprusCzech RepublicDenmarkDominicaDominican RepublicEarly-demographic dividendEast Asia & PacificEast Asia & Pacific (excluding high income)East Asia & Pacific (IDA & IBRD countries)EcuadorEgypt, Arab Rep.El SalvadorEquatorial GuineaEstoniaEthiopiaEuro areaEurope & Central AsiaEurope & Central Asia (excluding high income)Europe & Central Asia (IDA & IBRD countries)European UnionFaroe IslandsFijiFinlandFragile and conflict affected situationsFranceGabonGambia, TheGeorgiaGermanyGhanaGreeceGrenadaGuatemalaGuineaGuinea-BissauGuyanaHeavily indebted poor countries (HIPC)High incomeHondurasHong Kong SAR, ChinaHungaryIBRD onlyIcelandIDA & IBRD totalIDA blendIDA onlyIDA totalIndiaIndonesiaIran, Islamic Rep.IraqIrelandItalyJamaicaJapanJordanKazakhstanKenyaKiribatiKorea, Rep.KosovoKuwaitKyrgyz RepublicLao PDRLate-demographic dividendLatin America & Caribbean Latin America & Caribbean (excluding high income)Latin America & the Caribbean (IDA & IBRD countries)LatviaLeast developed countries: UN classificationLebanonLesothoLiberiaLithuaniaLow & middle incomeLow incomeLower middle incomeLuxembourgMacao SAR, ChinaMacedonia, FYRMadagascarMalawiMalaysiaMaldivesMaliMaltaMarshall IslandsMauritaniaMauritiusMexicoMicronesia, Fed. Sts.Middle East & North AfricaMiddle East & North Africa (excluding high income)Middle East & North Africa (IDA & IBRD countries)Middle incomeMoldovaMongoliaMontenegroMoroccoMozambiqueMyanmarNamibiaNepalNetherlandsNew ZealandNicaraguaNigerNigeriaNorth AmericaNorwayOECD membersOmanOther small statesPacific island small statesPakistanPalauPanamaParaguayPeruPhilippinesPolandPortugalPost-demographic dividendPre-demographic dividendPuerto RicoQatarRomaniaRussian FederationRwandaSamoaSao Tome and PrincipeSaudi ArabiaSenegalSerbiaSeychellesSierra LeoneSingaporeSlovak RepublicSloveniaSmall statesSouth AfricaSouth AsiaSouth Asia (IDA & IBRD)SpainSri LankaSt. Kitts and NevisSt. LuciaSt. Vincent and the GrenadinesSub-Saharan Africa Sub-Saharan Africa (excluding high income)Sub-Saharan Africa (IDA & IBRD countries)SudanSurinameSwazilandSwedenSwitzerlandTajikistanTanzaniaThailandTimor-LesteTogoTongaTrinidad and TobagoTunisiaTurkeyTurkmenistanTuvaluUgandaUkraineUnited Arab EmiratesUnited KingdomUnited StatesUpper middle incomeUruguayUzbekistanVanuatuVenezuela, RBVietnamWest Bank and GazaWorldYemen, Rep.ZambiaZimbabwe La ligne de temps
Cette échelle de temps montre un graphique de 1981 année à 2016 année Namibia. Les données jusqu'à 1980 année ne sont pas présentés. Quantité d'observations actuelles selon dates: 36.
Source (désignation):
Les indicateurs du développement mondiale
Source (organisation):
World Bank national accounts data, and OECD National Accounts data files.
Catégories:
Economy & Growth
Dernière mise à jour
23 avr. 2017
Les indicateurs de changement de valeurs selon les années
Minimum:
2.236 mds
1 janv. 1981
Maximum:
8.566 mds
1 janv. 2016
Pour la date d''observation
Valeur
Changement absolu
Le changement par rapport à la valeur précédente
1 janv. 1981
2.236 mds
+2.236 mds
0.0%
1 janv. 1982
2.318 mds
+81.655 mln.
3.65%
1 janv. 1983
2.348 mds
+30.572 mln.
1.32%
1 janv. 1984
2.366 mds
+17.536 mln.
0.75%
1 janv. 1985
2.389 mds
+22.973 mln.
0.97%
1 janv. 1986
2.39 mds
+1.079 mln.
0.05%
1 janv. 1987
2.484 mds
+94.46 mln.
3.95%
1 janv. 1988
2.589 mds
+104.836 mln.
4.22%
1 janv. 1989
2.611 mds
+22.167 mln.
0.86%
1 janv. 1990
2.675 mds
+64.27 mln.
2.46%
1 janv. 1991
2.662 mds
-13.559 mln.
-0.51%
1 janv. 1992
2.968 mds
+306.572 mln.
11.52%
1 janv. 1993
3.114 mds
+145.696 mln.
4.91%
1 janv. 1994
3.164 mds
+50.306 mln.
1.62%
1 janv. 1995
2.998 mds
-166.53 mln.
-5.26%
1 janv. 1996
3.133 mds
+135.511 mln.
4.52%
1 janv. 1997
3.328 mds
+194.393 mln.
6.2%
1 janv. 1998
3.466 mds
+138.663 mln.
4.17%
1 janv. 1999
3.513 mds
+46.712 mln.
1.35%
1 janv. 2000
3.638 mds
+124.939 mln.
3.56%
1 janv. 2001
3.763 mds
+125.281 mln.
3.44%
1 janv. 2002
3.929 mds
+165.111 mln.
4.39%
1 janv. 2003
3.925 mds
-3.358 mln.
-0.09%
1 janv. 2004
4.225 mds
+299.735 mln.
7.64%
1 janv. 2005
4.645 mds
+420.325 mln.
9.95%
1 janv. 2006
4.759 mds
+113.691 mln.
2.45%
1 janv. 2007
5.004 mds
+245.191 mln.
5.15%
1 janv. 2008
5.417 mds
+412.42 mln.
8.24%
1 janv. 2009
5.699 mds
+282.575 mln.
5.22%
1 janv. 2010
6.06 mds
+360.662 mln.
6.33%
1 janv. 2011
6.318 mds
+257.887 mln.
4.26%
1 janv. 2012
6.783 mds
+465.705 mln.
7.37%
1 janv. 2013
7.045 mds
+261.724 mln.
3.86%
1 janv. 2014
7.532 mds
+486.452 mln.
6.9%
1 janv. 2015
8.118 mds
+586.501 mln.
7.79%
1 janv. 2016
8.566 mds
+447.953 mln.
5.52%
Classement des pays selon les statistiques actuelles par années


Commentaires: