29
/fr/
fr
AIzaSyAYiBZKx7MnpbEhh9jyipgxe19OcubqV5w
April 1, 2024
249989
St. Kitts and Nevis
KNA
true
2
1
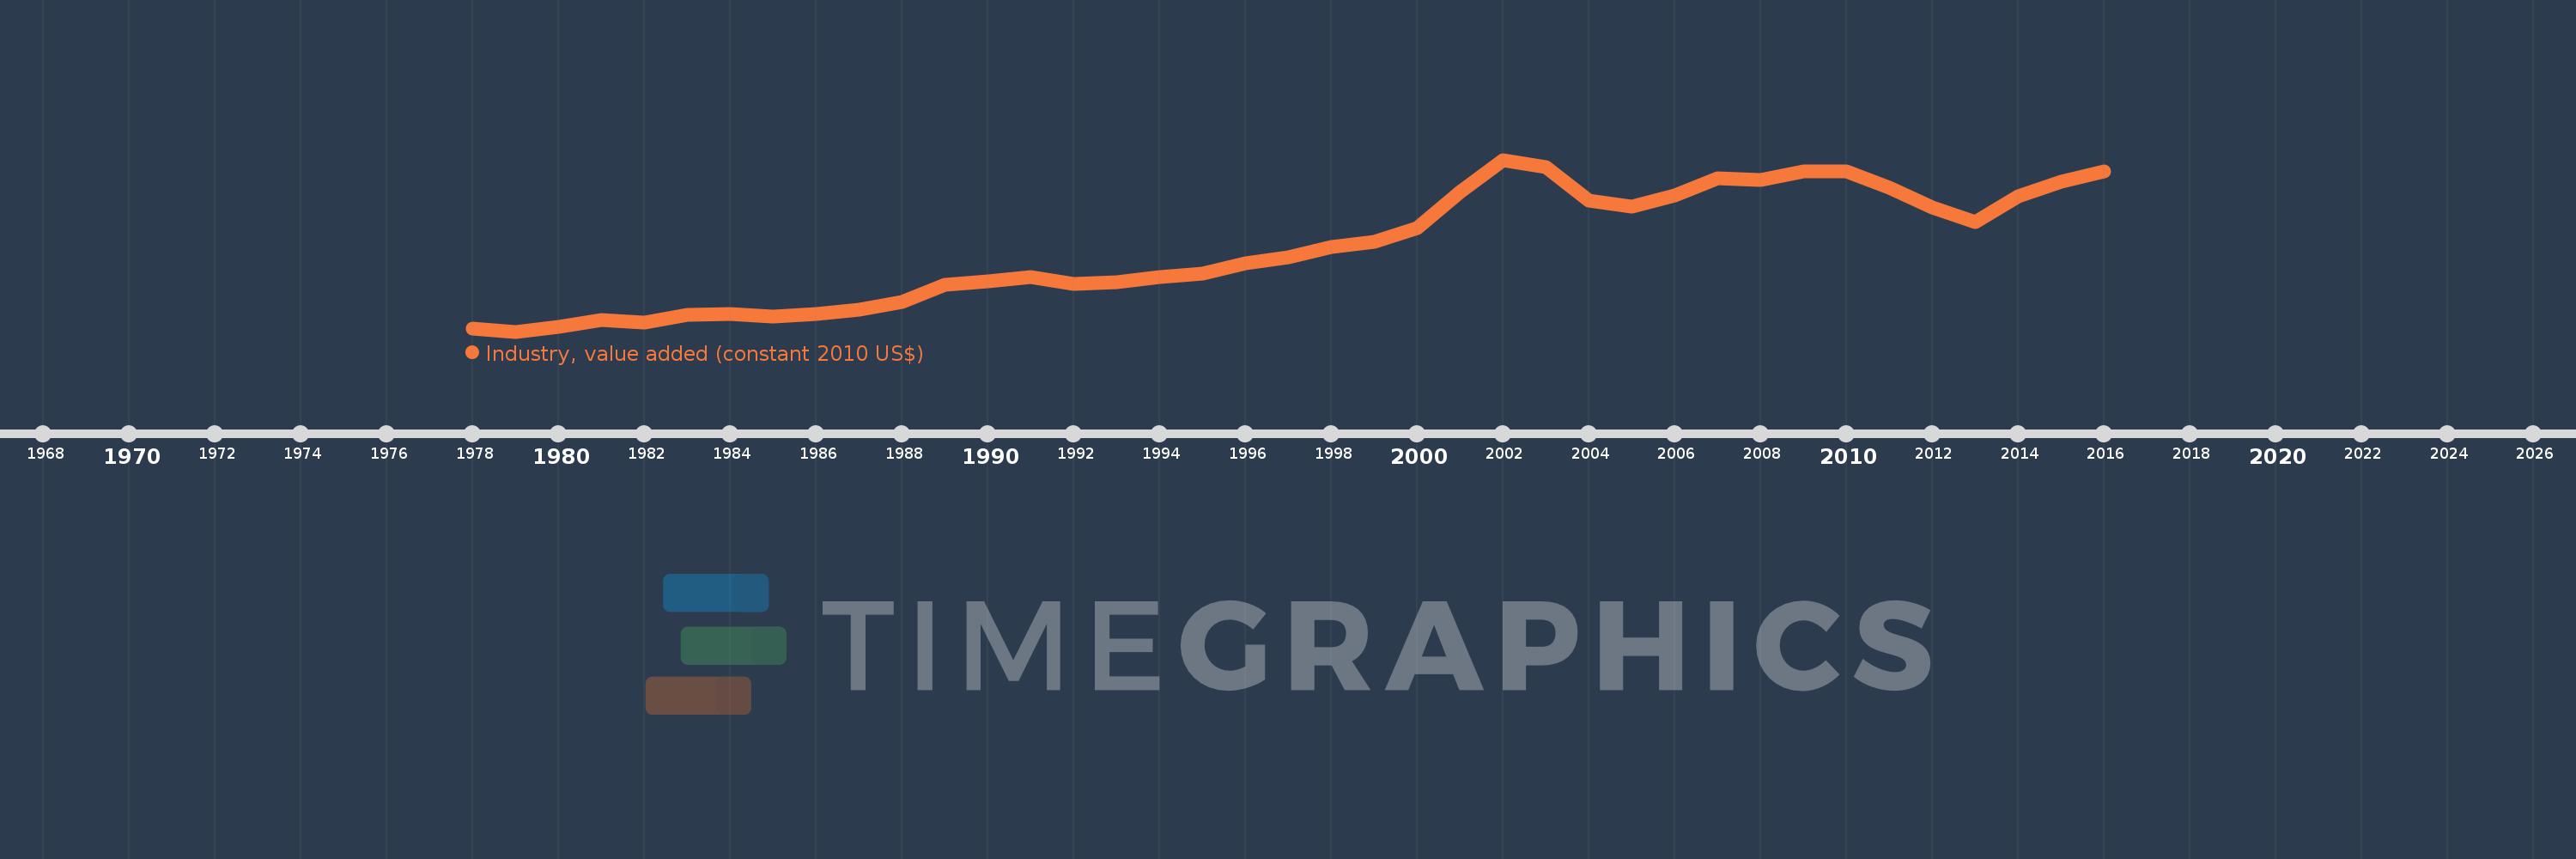
Industry, value added (constant 2010 US$)
2016,2015,2014,2013,2012,2011,2010,2009,2008,2007,2006,2005,2004,2003,2002,2001,2000,1999,1998,1997,1996,1995,1994,1993,1992,1991,1990,1989,1988,1987,1986,1985,1984,1983,1982,1981,1980,1979,1978
Cette statistique dans les autres pays:
AfghanistanAlbaniaAlgeriaAndorraAntigua and BarbudaArab WorldArgentinaArmeniaArubaAustraliaAustriaAzerbaijanBahamas, TheBahrainBangladeshBarbadosBelarusBelgiumBelizeBeninBermudaBhutanBoliviaBosnia and HerzegovinaBotswanaBrazilBrunei DarussalamBulgariaBurkina FasoBurundiCabo VerdeCambodiaCameroonCanadaCaribbean small statesCentral African RepublicCentral Europe and the BalticsChadChileChinaColombiaComorosCongo, Dem. Rep.Congo, Rep.Costa RicaCote d'IvoireCroatiaCubaCyprusCzech RepublicDenmarkDominicaDominican RepublicEarly-demographic dividendEast Asia & PacificEast Asia & Pacific (excluding high income)East Asia & Pacific (IDA & IBRD countries)EcuadorEgypt, Arab Rep.El SalvadorEquatorial GuineaEstoniaEthiopiaEuro areaEurope & Central AsiaEurope & Central Asia (excluding high income)Europe & Central Asia (IDA & IBRD countries)European UnionFijiFinlandFragile and conflict affected situationsFranceGabonGambia, TheGeorgiaGermanyGhanaGreeceGrenadaGuatemalaGuineaGuinea-BissauGuyanaHeavily indebted poor countries (HIPC)High incomeHondurasHong Kong SAR, ChinaHungaryIBRD onlyIcelandIDA & IBRD totalIDA blendIDA onlyIDA totalIndiaIndonesiaIran, Islamic Rep.IraqIrelandItalyJamaicaJapanJordanKazakhstanKenyaKiribatiKorea, Rep.KosovoKuwaitKyrgyz RepublicLao PDRLate-demographic dividendLatin America & Caribbean Latin America & Caribbean (excluding high income)Latin America & the Caribbean (IDA & IBRD countries)LatviaLeast developed countries: UN classificationLebanonLesothoLiberiaLiechtensteinLithuaniaLow & middle incomeLow incomeLower middle incomeLuxembourgMacao SAR, ChinaMacedonia, FYRMadagascarMalawiMalaysiaMaldivesMaliMaltaMarshall IslandsMauritaniaMauritiusMexicoMicronesia, Fed. Sts.Middle East & North AfricaMiddle East & North Africa (excluding high income)Middle East & North Africa (IDA & IBRD countries)Middle incomeMoldovaMongoliaMontenegroMoroccoMozambiqueMyanmarNamibiaNepalNetherlandsNew ZealandNicaraguaNigerNigeriaNorth AmericaNorwayOECD membersOmanOther small statesPacific island small statesPakistanPalauPanamaParaguayPeruPhilippinesPolandPortugalPost-demographic dividendPre-demographic dividendPuerto RicoQatarRomaniaRussian FederationRwandaSamoaSao Tome and PrincipeSaudi ArabiaSenegalSerbiaSeychellesSierra LeoneSingaporeSlovak RepublicSloveniaSmall statesSouth AfricaSouth AsiaSouth Asia (IDA & IBRD)SpainSri LankaSt. Kitts and NevisSt. LuciaSt. Vincent and the GrenadinesSub-Saharan Africa Sub-Saharan Africa (excluding high income)Sub-Saharan Africa (IDA & IBRD countries)SudanSurinameSwazilandSwedenSwitzerlandTajikistanTanzaniaThailandTimor-LesteTogoTongaTrinidad and TobagoTunisiaTurkeyTurkmenistanTuvaluUgandaUkraineUnited Arab EmiratesUnited KingdomUnited StatesUpper middle incomeUruguayUzbekistanVanuatuVenezuela, RBVietnamWest Bank and GazaWorldYemen, Rep.ZambiaZimbabwe La ligne de temps
Cette échelle de temps montre un graphique de 1978 année à 2016 année St. Kitts and Nevis. Les données jusqu'à 1977 année ne sont pas présentés. Quantité d'observations actuelles selon dates: 39.
Source (désignation):
Les indicateurs du développement mondiale
Source (organisation):
World Bank national accounts data, and OECD National Accounts data files.
Catégories:
Economy & Growth
Dernière mise à jour
23 avr. 2017
Les indicateurs de changement de valeurs selon les années
Minimum:
42.293 mln.
1 janv. 1979
Maximum:
201.488 mln.
1 janv. 2002
Pour la date d''observation
Valeur
Changement absolu
Le changement par rapport à la valeur précédente
1 janv. 1978
45.325 mln.
+45.325 mln.
0.0%
1 janv. 1979
42.293 mln.
-3.032 mln.
-6.69%
1 janv. 1980
46.493 mln.
+4.2 mln.
9.93%
1 janv. 1981
53.154 mln.
+6.661 mln.
14.33%
1 janv. 1982
50.822 mln.
-2.332 mln.
-4.39%
1 janv. 1983
57.524 mln.
+6.702 mln.
13.19%
1 janv. 1984
58.475 mln.
+951.278 milles
1.65%
1 janv. 1985
56.423 mln.
-2.052 mln.
-3.51%
1 janv. 1986
58.887 mln.
+2.465 mln.
4.37%
1 janv. 1987
62.706 mln.
+3.819 mln.
6.48%
1 janv. 1988
69.9 mln.
+7.194 mln.
11.47%
1 janv. 1989
85.465 mln.
+15.565 mln.
22.27%
1 janv. 1990
89.162 mln.
+3.697 mln.
4.33%
1 janv. 1991
92.795 mln.
+3.633 mln.
4.07%
1 janv. 1992
86.439 mln.
-6.356 mln.
-6.85%
1 janv. 1993
87.919 mln.
+1.48 mln.
1.71%
1 janv. 1994
93.021 mln.
+5.102 mln.
5.8%
1 janv. 1995
95.809 mln.
+2.788 mln.
3.0%
1 janv. 1996
105.887 mln.
+10.078 mln.
10.52%
1 janv. 1997
111.11 mln.
+5.223 mln.
4.93%
1 janv. 1998
120.824 mln.
+9.714 mln.
8.74%
1 janv. 1999
125.649 mln.
+4.825 mln.
3.99%
1 janv. 2000
137.933 mln.
+12.284 mln.
9.78%
1 janv. 2001
171.789 mln.
+33.856 mln.
24.55%
1 janv. 2002
201.488 mln.
+29.699 mln.
17.29%
1 janv. 2003
194.586 mln.
-6.902 mln.
-3.43%
1 janv. 2004
163.844 mln.
-30.742 mln.
-15.8%
1 janv. 2005
157.881 mln.
-5.963 mln.
-3.64%
1 janv. 2006
168.659 mln.
+10.778 mln.
6.83%
1 janv. 2007
184.078 mln.
+15.419 mln.
9.14%
1 janv. 2008
183.105 mln.
-972.892 milles
-0.53%
1 janv. 2009
190.793 mln.
+7.688 mln.
4.2%
1 janv. 2010
190.676 mln.
-117.35 milles
-0.06%
1 janv. 2011
175.557 mln.
-15.118 mln.
-7.93%
1 janv. 2012
157.368 mln.
-18.19 mln.
-10.36%
1 janv. 2013
143.759 mln.
-13.609 mln.
-8.65%
1 janv. 2014
167.538 mln.
+23.779 mln.
16.54%
1 janv. 2015
181.452 mln.
+13.913 mln.
8.3%
1 janv. 2016
191.107 mln.
+9.656 mln.
5.32%
Classement des pays selon les statistiques actuelles par années


Commentaires: