29
/fr/
fr
AIzaSyAYiBZKx7MnpbEhh9jyipgxe19OcubqV5w
April 1, 2024
167646
Kenya
KEN
true
2
1
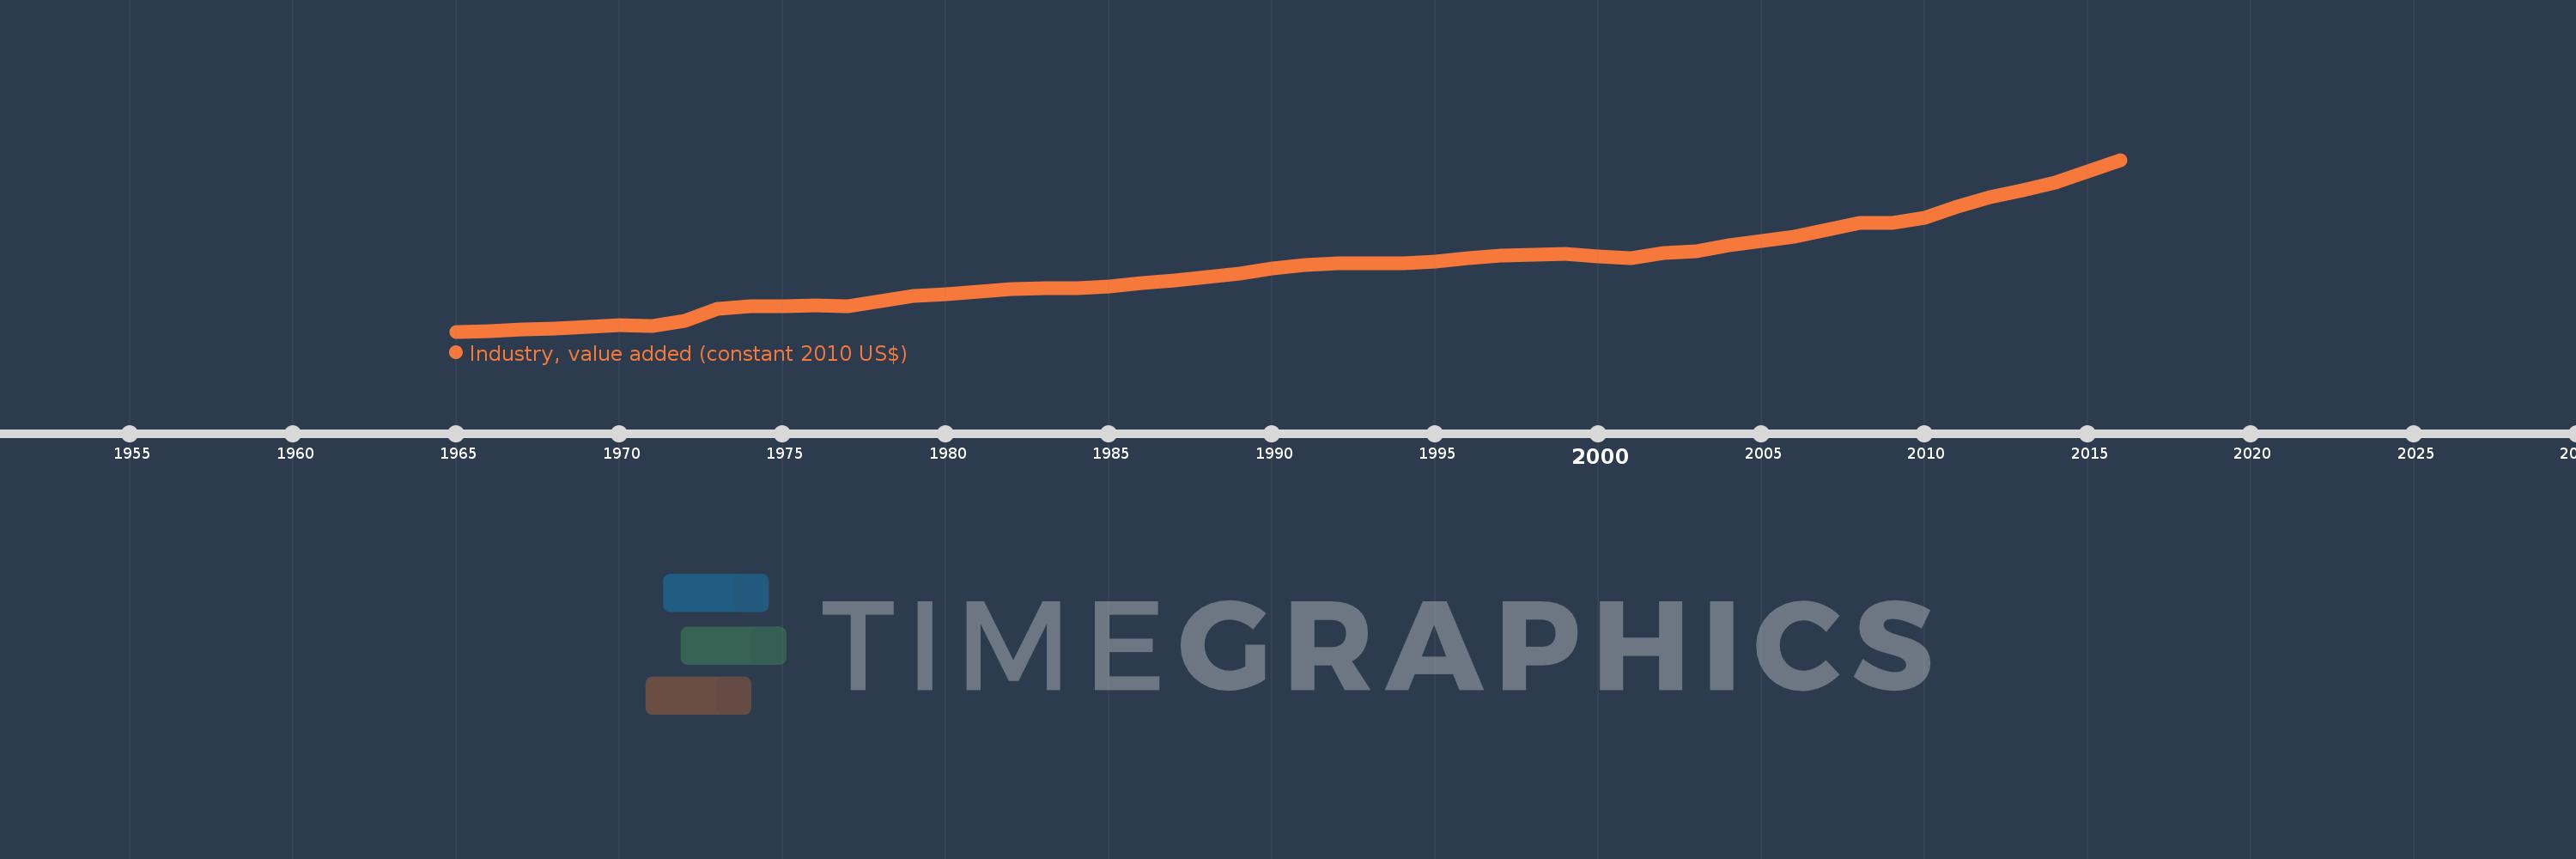
Industry, value added (constant 2010 US$)
2016,2015,2014,2013,2012,2011,2010,2009,2008,2007,2006,2005,2004,2003,2002,2001,2000,1999,1998,1997,1996,1995,1994,1993,1992,1991,1990,1989,1988,1987,1986,1985,1984,1983,1982,1981,1980,1979,1978,1977,1976,1975,1974,1973,1972,1971,1970,1969,1968,1967,1966,1965
Cette statistique dans les autres pays:
AfghanistanAlbaniaAlgeriaAndorraAntigua and BarbudaArab WorldArgentinaArmeniaArubaAustraliaAustriaAzerbaijanBahamas, TheBahrainBangladeshBarbadosBelarusBelgiumBelizeBeninBermudaBhutanBoliviaBosnia and HerzegovinaBotswanaBrazilBrunei DarussalamBulgariaBurkina FasoBurundiCabo VerdeCambodiaCameroonCanadaCaribbean small statesCentral African RepublicCentral Europe and the BalticsChadChileChinaColombiaComorosCongo, Dem. Rep.Congo, Rep.Costa RicaCote d'IvoireCroatiaCubaCyprusCzech RepublicDenmarkDominicaDominican RepublicEarly-demographic dividendEast Asia & PacificEast Asia & Pacific (excluding high income)East Asia & Pacific (IDA & IBRD countries)EcuadorEgypt, Arab Rep.El SalvadorEquatorial GuineaEstoniaEthiopiaEuro areaEurope & Central AsiaEurope & Central Asia (excluding high income)Europe & Central Asia (IDA & IBRD countries)European UnionFijiFinlandFragile and conflict affected situationsFranceGabonGambia, TheGeorgiaGermanyGhanaGreeceGrenadaGuatemalaGuineaGuinea-BissauGuyanaHeavily indebted poor countries (HIPC)High incomeHondurasHong Kong SAR, ChinaHungaryIBRD onlyIcelandIDA & IBRD totalIDA blendIDA onlyIDA totalIndiaIndonesiaIran, Islamic Rep.IraqIrelandItalyJamaicaJapanJordanKazakhstanKenyaKiribatiKorea, Rep.KosovoKuwaitKyrgyz RepublicLao PDRLate-demographic dividendLatin America & Caribbean Latin America & Caribbean (excluding high income)Latin America & the Caribbean (IDA & IBRD countries)LatviaLeast developed countries: UN classificationLebanonLesothoLiberiaLiechtensteinLithuaniaLow & middle incomeLow incomeLower middle incomeLuxembourgMacao SAR, ChinaMacedonia, FYRMadagascarMalawiMalaysiaMaldivesMaliMaltaMarshall IslandsMauritaniaMauritiusMexicoMicronesia, Fed. Sts.Middle East & North AfricaMiddle East & North Africa (excluding high income)Middle East & North Africa (IDA & IBRD countries)Middle incomeMoldovaMongoliaMontenegroMoroccoMozambiqueMyanmarNamibiaNepalNetherlandsNew ZealandNicaraguaNigerNigeriaNorth AmericaNorwayOECD membersOmanOther small statesPacific island small statesPakistanPalauPanamaParaguayPeruPhilippinesPolandPortugalPost-demographic dividendPre-demographic dividendPuerto RicoQatarRomaniaRussian FederationRwandaSamoaSao Tome and PrincipeSaudi ArabiaSenegalSerbiaSeychellesSierra LeoneSingaporeSlovak RepublicSloveniaSmall statesSouth AfricaSouth AsiaSouth Asia (IDA & IBRD)SpainSri LankaSt. Kitts and NevisSt. LuciaSt. Vincent and the GrenadinesSub-Saharan Africa Sub-Saharan Africa (excluding high income)Sub-Saharan Africa (IDA & IBRD countries)SudanSurinameSwazilandSwedenSwitzerlandTajikistanTanzaniaThailandTimor-LesteTogoTongaTrinidad and TobagoTunisiaTurkeyTurkmenistanTuvaluUgandaUkraineUnited Arab EmiratesUnited KingdomUnited StatesUpper middle incomeUruguayUzbekistanVanuatuVenezuela, RBVietnamWest Bank and GazaWorldYemen, Rep.ZambiaZimbabwe La ligne de temps
Cette échelle de temps montre un graphique de 1965 année à 2016 année Kenya. Les données jusqu'à 1964 année ne sont pas présentés. Quantité d'observations actuelles selon dates: 52.
Source (désignation):
Les indicateurs du développement mondiale
Source (organisation):
World Bank national accounts data, and OECD National Accounts data files.
Catégories:
Economy & Growth
Dernière mise à jour
23 avr. 2017
Les indicateurs de changement de valeurs selon les années
Minimum:
788.76 mln.
1 janv. 1965
Maximum:
9.933 mds
1 janv. 2016
Pour la date d''observation
Valeur
Changement absolu
Le changement par rapport à la valeur précédente
1 janv. 1965
788.76 mln.
+788.76 mln.
0.0%
1 janv. 1966
817.125 mln.
+28.365 mln.
3.6%
1 janv. 1967
882.587 mln.
+65.462 mln.
8.01%
1 janv. 1968
933.496 mln.
+50.909 mln.
5.77%
1 janv. 1969
1.056 mds
+122.882 mln.
13.16%
1 janv. 1970
1.135 mds
+79.019 mln.
7.48%
1 janv. 1971
1.071 mds
-64.339 mln.
-5.67%
1 janv. 1972
1.353 mds
+281.507 mln.
26.28%
1 janv. 1973
1.982 mds
+629.599 mln.
46.55%
1 janv. 1974
2.138 mds
+156.302 mln.
7.89%
1 janv. 1975
2.156 mds
+17.055 mln.
0.8%
1 janv. 1976
2.165 mds
+9.932 mln.
0.46%
1 janv. 1977
2.157 mds
-8.221 mln.
-0.38%
1 janv. 1978
2.434 mds
+277.217 mln.
12.85%
1 janv. 1979
2.692 mds
+257.405 mln.
10.57%
1 janv. 1980
2.787 mds
+95.129 mln.
3.53%
1 janv. 1981
2.936 mds
+148.591 mln.
5.33%
1 janv. 1982
3.053 mds
+117.443 mln.
4.0%
1 janv. 1983
3.105 mds
+51.573 mln.
1.69%
1 janv. 1984
3.119 mds
+14.655 mln.
0.47%
1 janv. 1985
3.186 mds
+66.432 mln.
2.13%
1 janv. 1986
3.373 mds
+187.117 mln.
5.87%
1 janv. 1987
3.507 mds
+134.141 mln.
3.98%
1 janv. 1988
3.692 mds
+185.484 mln.
5.29%
1 janv. 1989
3.89 mds
+197.918 mln.
5.36%
1 janv. 1990
4.131 mds
+240.402 mln.
6.18%
1 janv. 1991
4.323 mds
+192.709 mln.
4.67%
1 janv. 1992
4.433 mds
+109.58 mln.
2.53%
1 janv. 1993
4.431 mds
-2.298 mln.
-0.05%
1 janv. 1994
4.44 mds
+8.885 mln.
0.2%
1 janv. 1995
4.524 mds
+84.559 mln.
1.9%
1 janv. 1996
4.684 mds
+159.927 mln.
3.53%
1 janv. 1997
4.843 mds
+159.059 mln.
3.4%
1 janv. 1998
4.901 mds
+57.721 mln.
1.19%
1 janv. 1999
4.912 mds
+11.544 mln.
0.24%
1 janv. 2000
4.796 mds
-116.111 mln.
-2.36%
1 janv. 2001
4.708 mds
-87.87 mln.
-1.83%
1 janv. 2002
4.967 mds
+258.84 mln.
5.5%
1 janv. 2003
5.084 mds
+116.556 mln.
2.35%
1 janv. 2004
5.395 mds
+311.091 mln.
6.12%
1 janv. 2005
5.615 mds
+219.723 mln.
4.07%
1 janv. 2006
5.861 mds
+246.373 mln.
4.39%
1 janv. 2007
6.206 mds
+345.207 mln.
5.89%
1 janv. 2008
6.587 mds
+380.715 mln.
6.13%
1 janv. 2009
6.584 mds
-3.128 mln.
-0.05%
1 janv. 2010
6.827 mds
+243.337 mln.
3.7%
1 janv. 2011
7.42 mds
+592.708 mln.
8.68%
1 janv. 2012
7.957 mds
+537.586 mln.
7.25%
1 janv. 2013
8.29 mds
+332.409 mln.
4.18%
1 janv. 2014
8.73 mds
+440.186 mln.
5.31%
1 janv. 2015
9.295 mds
+564.658 mln.
6.47%
1 janv. 2016
9.933 mds
+638.751 mln.
6.87%
Classement des pays selon les statistiques actuelles par années


Commentaires: