29
/fr/
fr
AIzaSyAYiBZKx7MnpbEhh9jyipgxe19OcubqV5w
April 1, 2024
243664
Solomon Islands
SLB
true
2
1
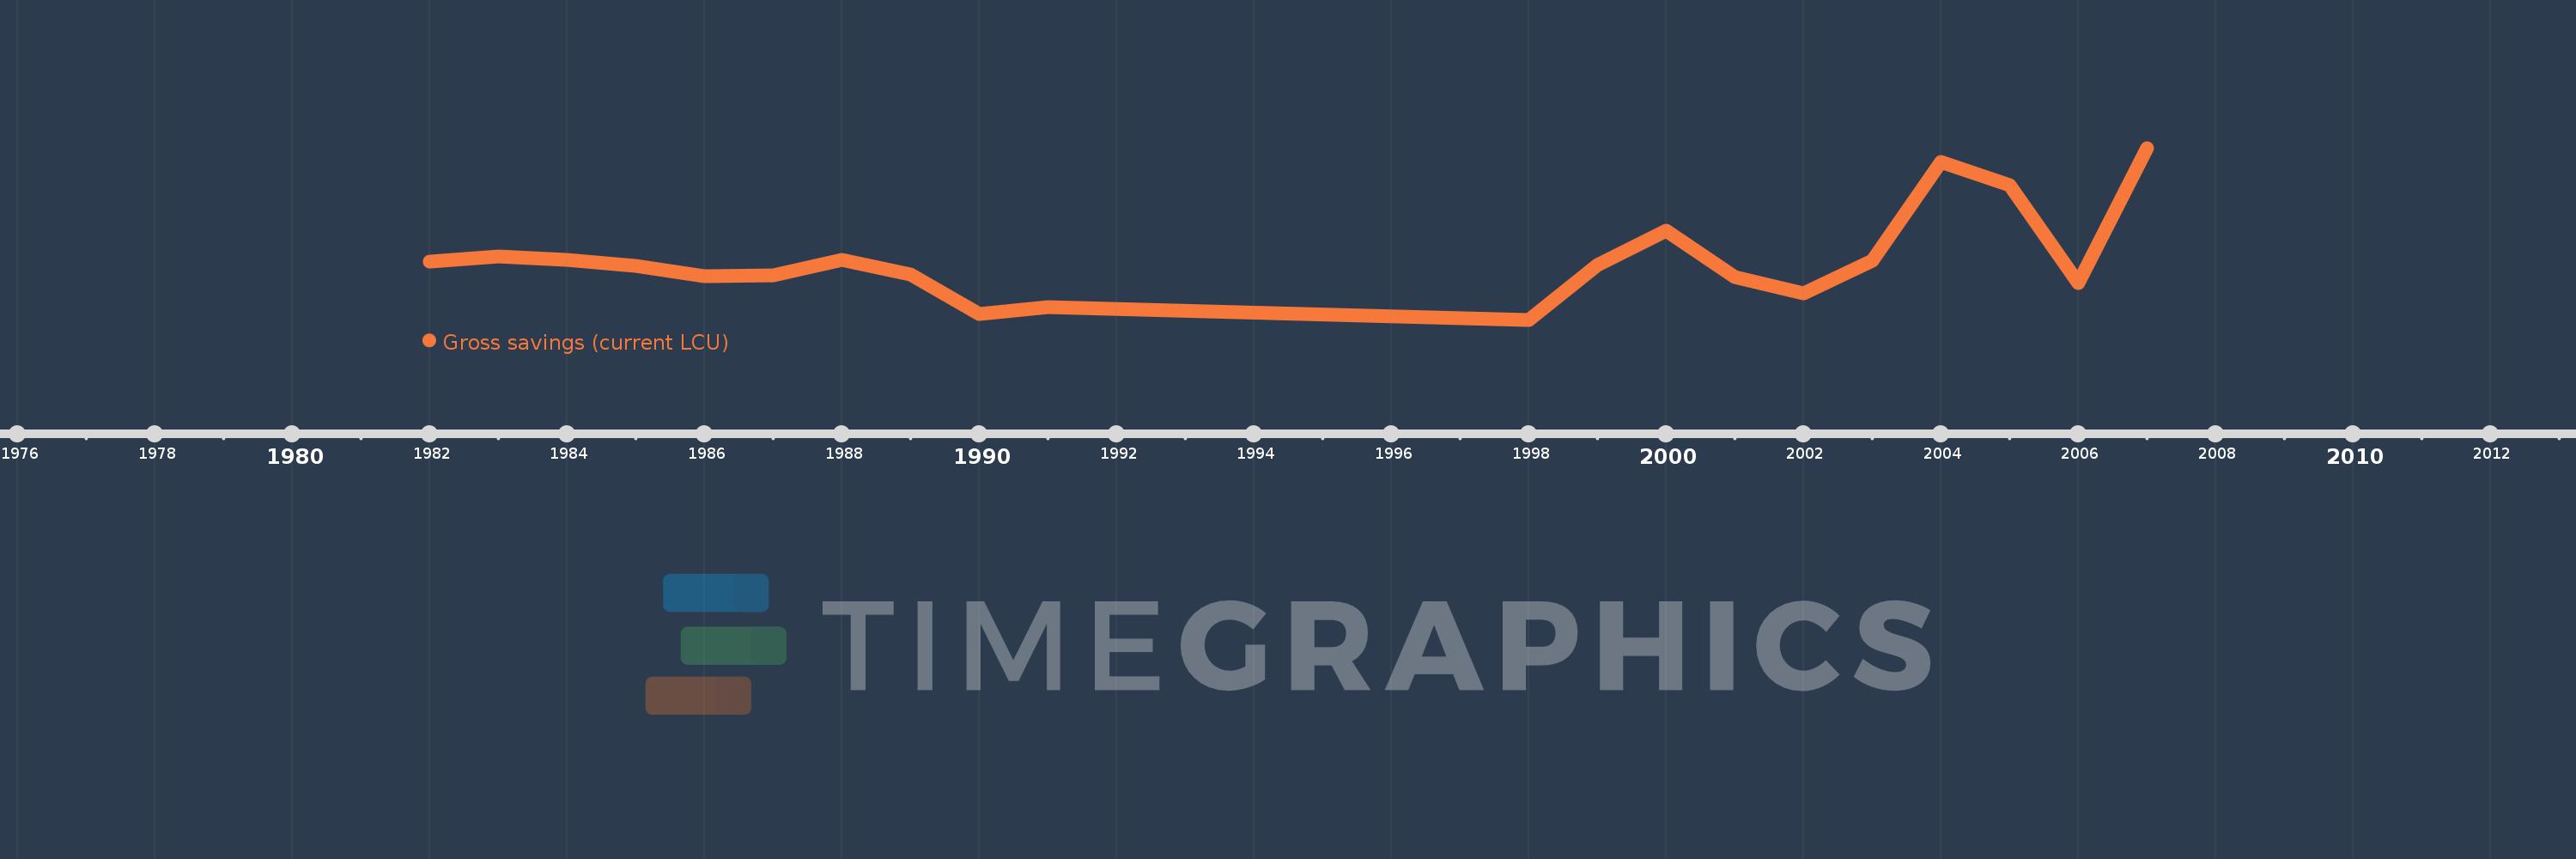
Gross savings (current LCU)
2007,2006,2005,2004,2003,2002,2001,2000,1999,1998,1991,1990,1989,1988,1987,1986,1985,1984,1983,1982
Cette statistique dans les autres pays:
AfghanistanAlbaniaAlgeriaAngolaAntigua and BarbudaArgentinaArmeniaAustraliaAustriaAzerbaijanBahamas, TheBahrainBangladeshBarbadosBelarusBelgiumBelizeBeninBermudaBhutanBoliviaBosnia and HerzegovinaBotswanaBrazilBrunei DarussalamBulgariaBurkina FasoBurundiCabo VerdeCambodiaCameroonCanadaCentral African RepublicChadChileChinaColombiaComorosCongo, Dem. Rep.Congo, Rep.Costa RicaCote d'IvoireCroatiaCyprusCzech RepublicDenmarkDjiboutiDominicaDominican RepublicEcuadorEgypt, Arab Rep.El SalvadorEquatorial GuineaEritreaEstoniaEthiopiaFaroe IslandsFijiFinlandFranceGabonGambia, TheGeorgiaGermanyGhanaGreeceGrenadaGuatemalaGuineaGuinea-BissauGuyanaHaitiHondurasHong Kong SAR, ChinaHungaryIcelandIndiaIndonesiaIran, Islamic Rep.IraqIrelandIsraelItalyJamaicaJapanJordanKazakhstanKenyaKiribatiKorea, Rep.KosovoKuwaitKyrgyz RepublicLao PDRLatviaLebanonLesothoLiberiaLibyaLithuaniaLuxembourgMacao SAR, ChinaMacedonia, FYRMadagascarMalawiMalaysiaMaldivesMaliMaltaMauritaniaMauritiusMexicoMoldovaMongoliaMontenegroMoroccoMozambiqueNamibiaNepalNetherlandsNew ZealandNicaraguaNigerNigeriaNorwayOmanPakistanPanamaPapua New GuineaParaguayPeruPhilippinesPolandPortugalQatarRomaniaRussian FederationRwandaSaudi ArabiaSenegalSerbiaSeychellesSierra LeoneSingaporeSlovak RepublicSloveniaSolomon IslandsSouth AfricaSouth SudanSpainSri LankaSt. Kitts and NevisSt. LuciaSt. Vincent and the GrenadinesSudanSurinameSwazilandSwedenSwitzerlandSyrian Arab RepublicTajikistanTanzaniaThailandTimor-LesteTogoTongaTrinidad and TobagoTunisiaTurkeyUgandaUkraineUnited KingdomUnited StatesUruguayVanuatuVenezuela, RBVietnamWest Bank and GazaYemen, Rep.ZambiaZimbabwe La ligne de temps
Cette échelle de temps montre un graphique de 1982 année à 2007 année Solomon Islands. Les données jusqu'à 1981 année ne sont pas présentés. Quantité d'observations actuelles selon dates: 20.
Source (désignation):
Les indicateurs du développement mondiale
Source (organisation):
World Bank national accounts data, and OECD National Accounts data files.
Catégories:
Economy & Growth
Dernière mise à jour
23 avr. 2017
Les indicateurs de changement de valeurs selon les années
Minimum:
-303.65 mln.
1 janv. 1998
Maximum:
357.666 mln.
1 janv. 2007
Pour la date d''observation
Valeur
Changement absolu
Le changement par rapport à la valeur précédente
1 janv. 1982
-79.4 mln.
-79.4 mln.
0.0%
1 janv. 1983
-61.3 mln.
+18.1 mln.
-22.8%
1 janv. 1984
-71.999 mln.
-10.699 mln.
17.45%
1 janv. 1985
-97.5 mln.
-25.501 mln.
35.42%
1 janv. 1986
-137.2 mln.
-39.699 mln.
40.72%
1 janv. 1987
-131.3 mln.
+5.9 mln.
-4.3%
1 janv. 1988
-73.4 mln.
+57.9 mln.
-44.1%
1 janv. 1989
-129.001 mln.
-55.601 mln.
75.75%
1 janv. 1990
-280.802 mln.
-151.801 mln.
117.67%
1 janv. 1991
-254.399 mln.
+26.402 mln.
-9.4%
1 janv. 1998
-303.65 mln.
-49.251 mln.
19.36%
1 janv. 1999
-93.874 mln.
+209.776 mln.
-69.08%
1 janv. 2000
39.638 mln.
+133.512 mln.
-142.22%
1 janv. 2001
-139.365 mln.
-179.003 mln.
-451.59%
1 janv. 2002
-201.425 mln.
-62.06 mln.
44.53%
1 janv. 2003
-77.863 mln.
+123.561 mln.
-61.34%
1 janv. 2004
302.809 mln.
+380.673 mln.
-488.9%
1 janv. 2005
214.755 mln.
-88.054 mln.
-29.08%
1 janv. 2006
-160.876 mln.
-375.631 mln.
-174.91%
1 janv. 2007
357.666 mln.
+518.541 mln.
-322.32%
Classement des pays selon les statistiques actuelles par années


Commentaires: