29
/fr/
fr
AIzaSyAYiBZKx7MnpbEhh9jyipgxe19OcubqV5w
April 1, 2024
132067
Fiji
FJI
true
2
1
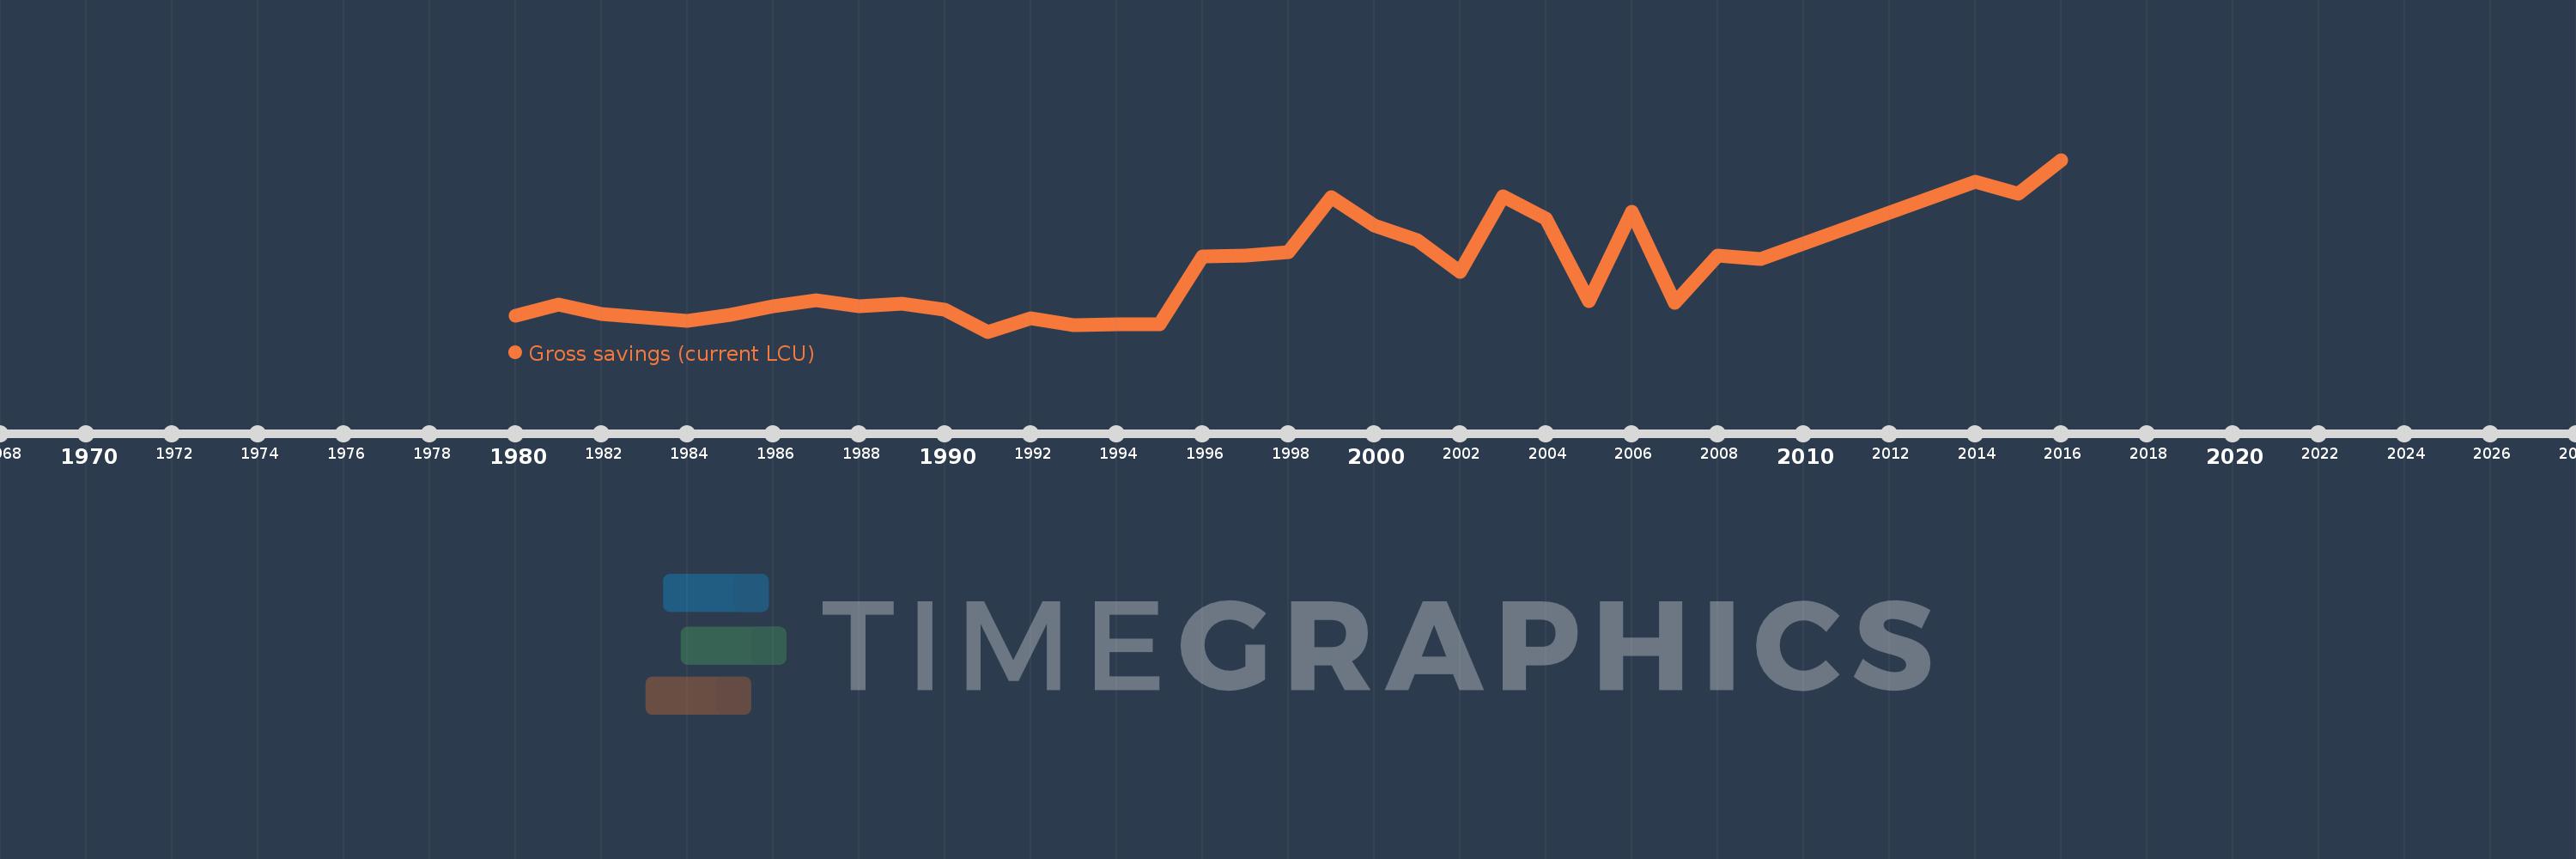
Gross savings (current LCU)
2016,2015,2014,2009,2008,2007,2006,2005,2004,2003,2002,2001,2000,1999,1998,1997,1996,1995,1994,1993,1992,1991,1990,1989,1988,1987,1986,1985,1984,1983,1982,1981,1980
Cette statistique dans les autres pays:
AfghanistanAlbaniaAlgeriaAngolaAntigua and BarbudaArgentinaArmeniaAustraliaAustriaAzerbaijanBahamas, TheBahrainBangladeshBarbadosBelarusBelgiumBelizeBeninBermudaBhutanBoliviaBosnia and HerzegovinaBotswanaBrazilBrunei DarussalamBulgariaBurkina FasoBurundiCabo VerdeCambodiaCameroonCanadaCentral African RepublicChadChileChinaColombiaComorosCongo, Dem. Rep.Congo, Rep.Costa RicaCote d'IvoireCroatiaCyprusCzech RepublicDenmarkDjiboutiDominicaDominican RepublicEcuadorEgypt, Arab Rep.El SalvadorEquatorial GuineaEritreaEstoniaEthiopiaFaroe IslandsFijiFinlandFranceGabonGambia, TheGeorgiaGermanyGhanaGreeceGrenadaGuatemalaGuineaGuinea-BissauGuyanaHaitiHondurasHong Kong SAR, ChinaHungaryIcelandIndiaIndonesiaIran, Islamic Rep.IraqIrelandIsraelItalyJamaicaJapanJordanKazakhstanKenyaKiribatiKorea, Rep.KosovoKuwaitKyrgyz RepublicLao PDRLatviaLebanonLesothoLiberiaLibyaLithuaniaLuxembourgMacao SAR, ChinaMacedonia, FYRMadagascarMalawiMalaysiaMaldivesMaliMaltaMauritaniaMauritiusMexicoMoldovaMongoliaMontenegroMoroccoMozambiqueNamibiaNepalNetherlandsNew ZealandNicaraguaNigerNigeriaNorwayOmanPakistanPanamaPapua New GuineaParaguayPeruPhilippinesPolandPortugalQatarRomaniaRussian FederationRwandaSaudi ArabiaSenegalSerbiaSeychellesSierra LeoneSingaporeSlovak RepublicSloveniaSolomon IslandsSouth AfricaSouth SudanSpainSri LankaSt. Kitts and NevisSt. LuciaSt. Vincent and the GrenadinesSudanSurinameSwazilandSwedenSwitzerlandSyrian Arab RepublicTajikistanTanzaniaThailandTimor-LesteTogoTongaTrinidad and TobagoTunisiaTurkeyUgandaUkraineUnited KingdomUnited StatesUruguayVanuatuVenezuela, RBVietnamWest Bank and GazaYemen, Rep.ZambiaZimbabwe La ligne de temps
Cette échelle de temps montre un graphique de 1980 année à 2016 année Fiji. Les données jusqu'à 1979 année ne sont pas présentés. Quantité d'observations actuelles selon dates: 33.
Source (désignation):
Les indicateurs du développement mondiale
Source (organisation):
World Bank national accounts data, and OECD National Accounts data files.
Catégories:
Economy & Growth
Dernière mise à jour
23 avr. 2017
Les indicateurs de changement de valeurs selon les années
Minimum:
115.2 mln.
1 janv. 1991
Maximum:
1.196 mds
1 janv. 2016
Pour la date d''observation
Valeur
Changement absolu
Le changement par rapport à la valeur précédente
1 janv. 1980
217.656 mln.
+217.656 mln.
0.0%
1 janv. 1981
284.331 mln.
+66.676 mln.
30.63%
1 janv. 1982
224.479 mln.
-59.852 mln.
-21.05%
1 janv. 1983
202.319 mln.
-22.16 mln.
-9.87%
1 janv. 1984
183.939 mln.
-18.38 mln.
-9.08%
1 janv. 1985
220.707 mln.
+36.769 mln.
19.99%
1 janv. 1986
273.078 mln.
+52.37 mln.
23.73%
1 janv. 1987
314.777 mln.
+41.699 mln.
15.27%
1 janv. 1988
275.179 mln.
-39.597 mln.
-12.58%
1 janv. 1989
290.861 mln.
+15.682 mln.
5.7%
1 janv. 1990
255.075 mln.
-35.786 mln.
-12.3%
1 janv. 1991
115.2 mln.
-139.875 mln.
-54.84%
1 janv. 1992
198.1 mln.
+82.9 mln.
71.96%
1 janv. 1993
158.2 mln.
-39.9 mln.
-20.14%
1 janv. 1994
159.5 mln.
+1.3 mln.
0.82%
1 janv. 1995
160.1 mln.
+599.586 milles
0.38%
1 janv. 1996
588.9 mln.
+428.8 mln.
267.83%
1 janv. 1997
592.8 mln.
+3.9 mln.
0.66%
1 janv. 1998
613.101 mln.
+20.301 mln.
3.42%
1 janv. 1999
960.099 mln.
+346.999 mln.
56.6%
1 janv. 2000
784.799 mln.
-175.3 mln.
-18.26%
1 janv. 2001
693.283 mln.
-91.516 mln.
-11.66%
1 janv. 2002
491.67 mln.
-201.613 mln.
-29.08%
1 janv. 2003
964.06 mln.
+472.389 mln.
96.08%
1 janv. 2004
823.961 mln.
-140.099 mln.
-14.53%
1 janv. 2005
305.393 mln.
-518.568 mln.
-62.94%
1 janv. 2006
870.019 mln.
+564.627 mln.
184.89%
1 janv. 2007
297.077 mln.
-572.943 mln.
-65.85%
1 janv. 2008
595.395 mln.
+298.318 mln.
100.42%
1 janv. 2009
572.619 mln.
-22.776 mln.
-3.83%
1 janv. 2014
1.057 mds
+484.27 mln.
84.57%
1 janv. 2015
985.493 mln.
-71.396 mln.
-6.76%
1 janv. 2016
1.196 mds
+210.832 mln.
21.39%
Classement des pays selon les statistiques actuelles par années


Commentaires: