29
/fr/
fr
AIzaSyAYiBZKx7MnpbEhh9jyipgxe19OcubqV5w
April 1, 2024
24000
Arab World
ARB
false
2
1
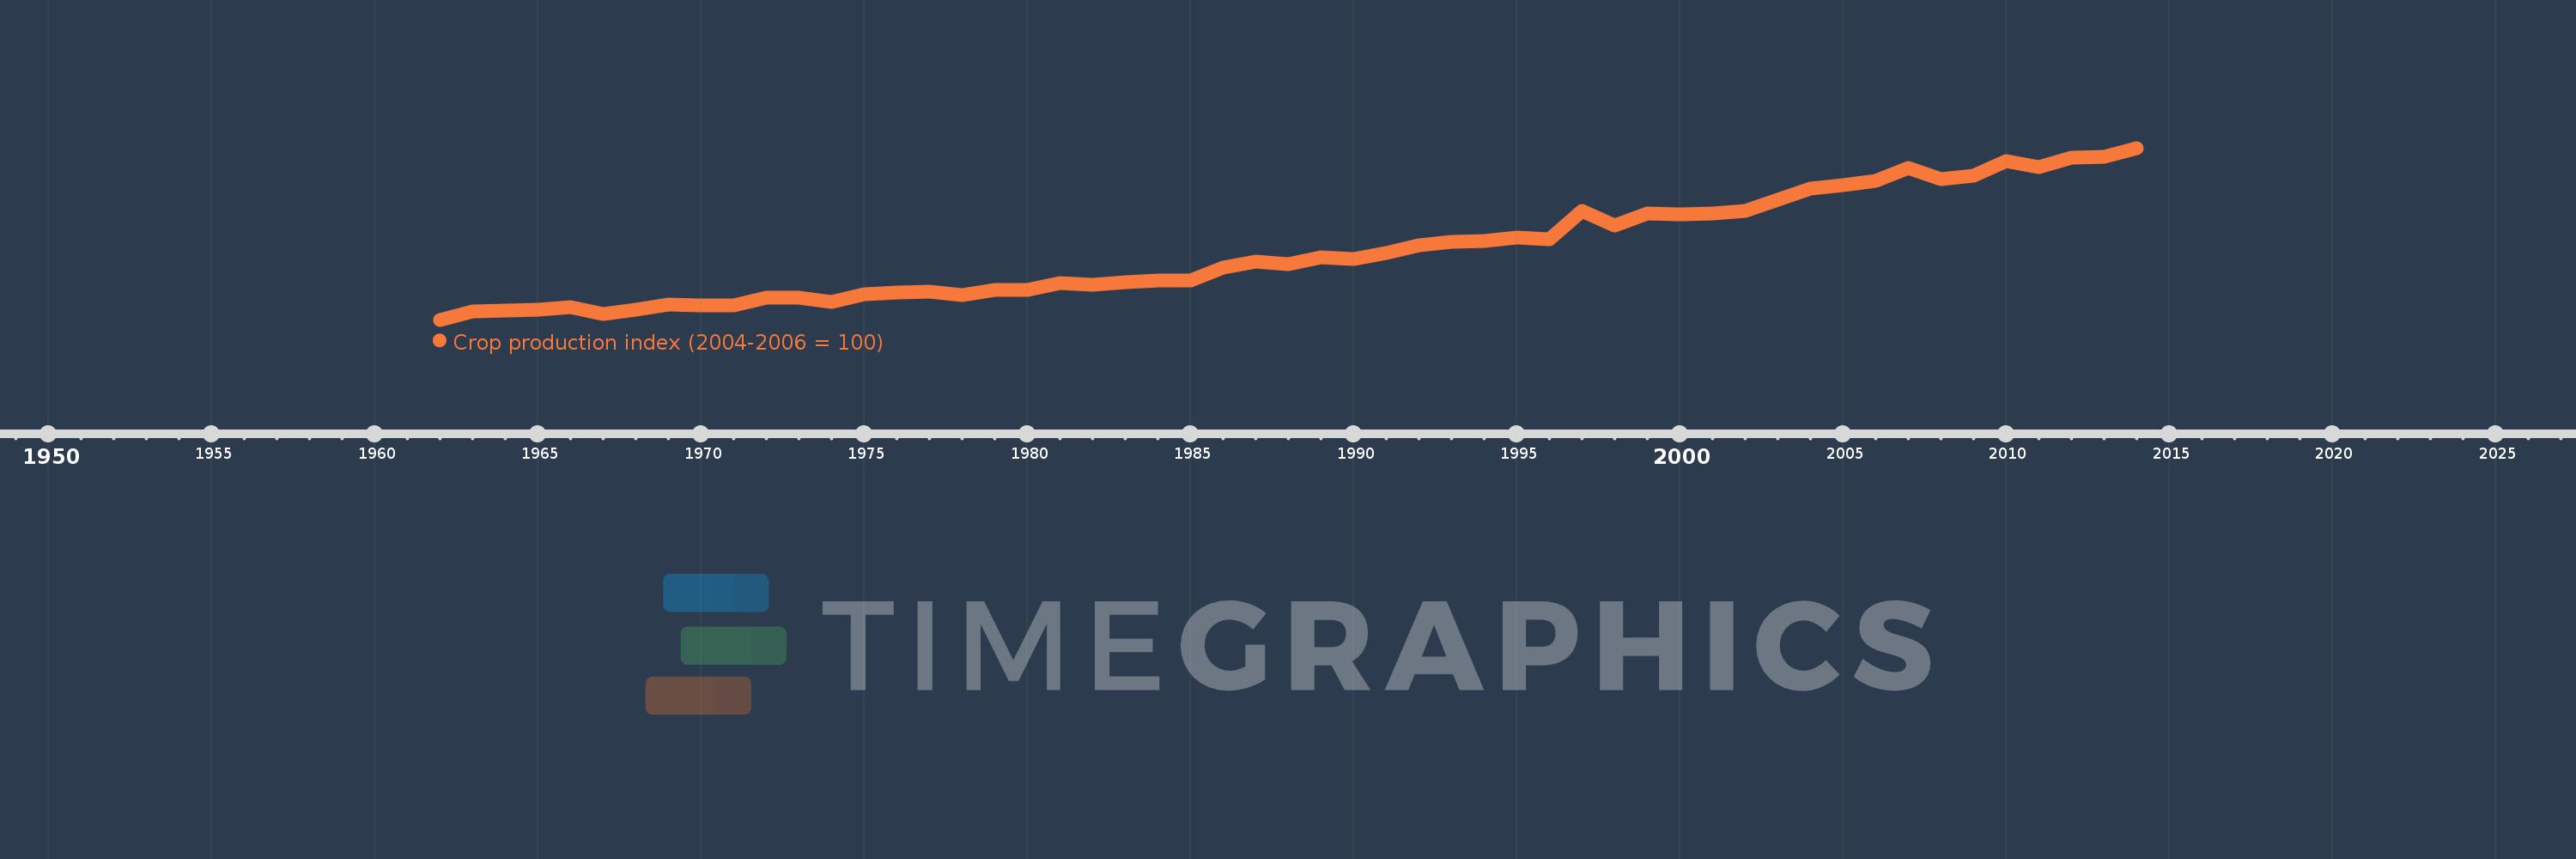
Crop production index (2004-2006 = 100)
2014,2013,2012,2011,2010,2009,2008,2007,2006,2005,2004,2003,2002,2001,2000,1999,1998,1997,1996,1995,1994,1993,1992,1991,1990,1989,1988,1987,1986,1985,1984,1983,1982,1981,1980,1979,1978,1977,1976,1975,1974,1973,1972,1971,1970,1969,1968,1967,1966,1965,1964,1963,1962
Cette statistique dans les autres pays:
AfghanistanAlbaniaAlgeriaAmerican SamoaAngolaAntigua and BarbudaArab WorldArgentinaArmeniaAustraliaAustriaAzerbaijanBahamas, TheBahrainBangladeshBarbadosBelarusBelgiumBelizeBeninBermudaBhutanBoliviaBosnia and HerzegovinaBotswanaBrazilBritish Virgin IslandsBrunei DarussalamBulgariaBurkina FasoBurundiCabo VerdeCambodiaCameroonCanadaCaribbean small statesCayman IslandsCentral African RepublicCentral Europe and the BalticsChadChileChinaColombiaComorosCongo, Dem. Rep.Congo, Rep.Costa RicaCote d'IvoireCroatiaCubaCyprusCzech RepublicDenmarkDjiboutiDominicaDominican RepublicEarly-demographic dividendEast Asia & PacificEast Asia & Pacific (excluding high income)East Asia & Pacific (IDA & IBRD countries)EcuadorEgypt, Arab Rep.El SalvadorEquatorial GuineaEritreaEstoniaEthiopiaEuro areaEurope & Central AsiaEurope & Central Asia (excluding high income)Europe & Central Asia (IDA & IBRD countries)European UnionFaroe IslandsFijiFinlandFragile and conflict affected situationsFranceFrench PolynesiaGabonGambia, TheGeorgiaGermanyGhanaGreeceGrenadaGuamGuatemalaGuineaGuinea-BissauGuyanaHaitiHeavily indebted poor countries (HIPC)High incomeHondurasHong Kong SAR, ChinaHungaryIBRD onlyIcelandIDA & IBRD totalIDA blendIDA onlyIDA totalIndiaIndonesiaIran, Islamic Rep.IraqIrelandIsraelItalyJamaicaJapanJordanKazakhstanKenyaKiribatiKorea, Dem. People’s Rep.Korea, Rep.KuwaitKyrgyz RepublicLao PDRLate-demographic dividendLatin America & Caribbean Latin America & Caribbean (excluding high income)Latin America & the Caribbean (IDA & IBRD countries)LatviaLeast developed countries: UN classificationLebanonLesothoLiberiaLibyaLiechtensteinLithuaniaLow & middle incomeLow incomeLower middle incomeLuxembourgMacao SAR, ChinaMacedonia, FYRMadagascarMalawiMalaysiaMaldivesMaliMaltaMarshall IslandsMauritaniaMauritiusMexicoMicronesia, Fed. Sts.Middle East & North AfricaMiddle East & North Africa (excluding high income)Middle East & North Africa (IDA & IBRD countries)Middle incomeMoldovaMongoliaMontenegroMoroccoMozambiqueMyanmarNamibiaNauruNepalNetherlandsNew CaledoniaNew ZealandNicaraguaNigerNigeriaNorth AmericaNorwayOECD membersOmanOther small statesPacific island small statesPakistanPanamaPapua New GuineaParaguayPeruPhilippinesPolandPortugalPost-demographic dividendPre-demographic dividendPuerto RicoQatarRomaniaRussian FederationRwandaSamoaSao Tome and PrincipeSaudi ArabiaSenegalSerbiaSeychellesSierra LeoneSingaporeSlovak RepublicSloveniaSmall statesSolomon IslandsSomaliaSouth AfricaSouth AsiaSouth Asia (IDA & IBRD)SpainSri LankaSt. Kitts and NevisSt. LuciaSt. Vincent and the GrenadinesSub-Saharan Africa Sub-Saharan Africa (excluding high income)Sub-Saharan Africa (IDA & IBRD countries)SudanSurinameSwazilandSwedenSwitzerlandSyrian Arab RepublicTajikistanTanzaniaThailandTimor-LesteTogoTongaTrinidad and TobagoTunisiaTurkeyTurkmenistanTuvaluUgandaUkraineUnited Arab EmiratesUnited KingdomUnited StatesUpper middle incomeUruguayUzbekistanVanuatuVenezuela, RBVietnamWest Bank and GazaWorldYemen, Rep.ZambiaZimbabwe La ligne de temps
Cette échelle de temps montre un graphique de 1962 année à 2014 année Arab World. Les données jusqu'à 1961 année ne sont pas présentés. Quantité d'observations actuelles selon dates: 53.
Source (désignation):
Les indicateurs du développement mondiale
Source (organisation):
Food and Agriculture Organization, electronic files and web site.
Catégories:
Agriculture & Rural Development
Dernière mise à jour
23 avr. 2017
Les indicateurs de changement de valeurs selon les années
Minimum:
25.154
1 janv. 1962
Maximum:
115.902
1 janv. 2014
Pour la date d''observation
Valeur
Changement absolu
Le changement par rapport à la valeur précédente
1 janv. 1962
25.154
+25.154
0.0%
1 janv. 1963
29.462
+4.308
17.13%
1 janv. 1964
30.214
+0.752
2.55%
1 janv. 1965
30.376
+0.162
0.54%
1 janv. 1966
31.795
+1.42
4.67%
1 janv. 1967
28.147
-3.649
-11.48%
1 janv. 1968
30.362
+2.215
7.87%
1 janv. 1969
33.241
+2.88
9.48%
1 janv. 1970
32.581
-0.66
-1.99%
1 janv. 1971
32.841
+0.259
0.8%
1 janv. 1972
36.611
+3.77
11.48%
1 janv. 1973
36.904
+0.294
0.8%
1 janv. 1974
34.587
-2.318
-6.28%
1 janv. 1975
38.833
+4.247
12.28%
1 janv. 1976
39.761
+0.928
2.39%
1 janv. 1977
40.177
+0.416
1.05%
1 janv. 1978
38.225
-1.952
-4.86%
1 janv. 1979
40.874
+2.649
6.93%
1 janv. 1980
40.673
-0.201
-0.49%
1 janv. 1981
44.319
+3.647
8.97%
1 janv. 1982
43.529
-0.79
-1.78%
1 janv. 1983
45.14
+1.61
3.7%
1 janv. 1984
45.854
+0.715
1.58%
1 janv. 1985
45.852
-0.002
0.0%
1 janv. 1986
52.693
+6.84
14.92%
1 janv. 1987
55.692
+2.999
5.69%
1 janv. 1988
54.519
-1.172
-2.11%
1 janv. 1989
57.941
+3.421
6.28%
1 janv. 1990
57.089
-0.851
-1.47%
1 janv. 1991
60.443
+3.353
5.87%
1 janv. 1992
64.639
+4.196
6.94%
1 janv. 1993
66.443
+1.804
2.79%
1 janv. 1994
66.925
+0.482
0.73%
1 janv. 1995
68.473
+1.548
2.31%
1 janv. 1996
67.844
-0.63
-0.92%
1 janv. 1997
82.453
+14.609
21.53%
1 janv. 1998
74.822
-7.631
-9.25%
1 janv. 1999
81.231
+6.409
8.57%
1 janv. 2000
80.692
-0.539
-0.66%
1 janv. 2001
81.088
+0.395
0.49%
1 janv. 2002
82.747
+1.659
2.05%
1 janv. 2003
88.622
+5.875
7.1%
1 janv. 2004
94.302
+5.68
6.41%
1 janv. 2005
96.318
+2.015
2.14%
1 janv. 2006
98.445
+2.128
2.21%
1 janv. 2007
105.237
+6.792
6.9%
1 janv. 2008
99.278
-5.959
-5.66%
1 janv. 2009
101.396
+2.118
2.13%
1 janv. 2010
109.095
+7.699
7.59%
1 janv. 2011
105.597
-3.498
-3.21%
1 janv. 2012
110.938
+5.341
5.06%
1 janv. 2013
111.352
+0.414
0.37%
1 janv. 2014
115.902
+4.55
4.09%
Classement des pays selon les statistiques actuelles par années


Commentaires: