29
/fr/
fr
AIzaSyAYiBZKx7MnpbEhh9jyipgxe19OcubqV5w
April 1, 2024
140186
Ghana
GHA
true
2
1
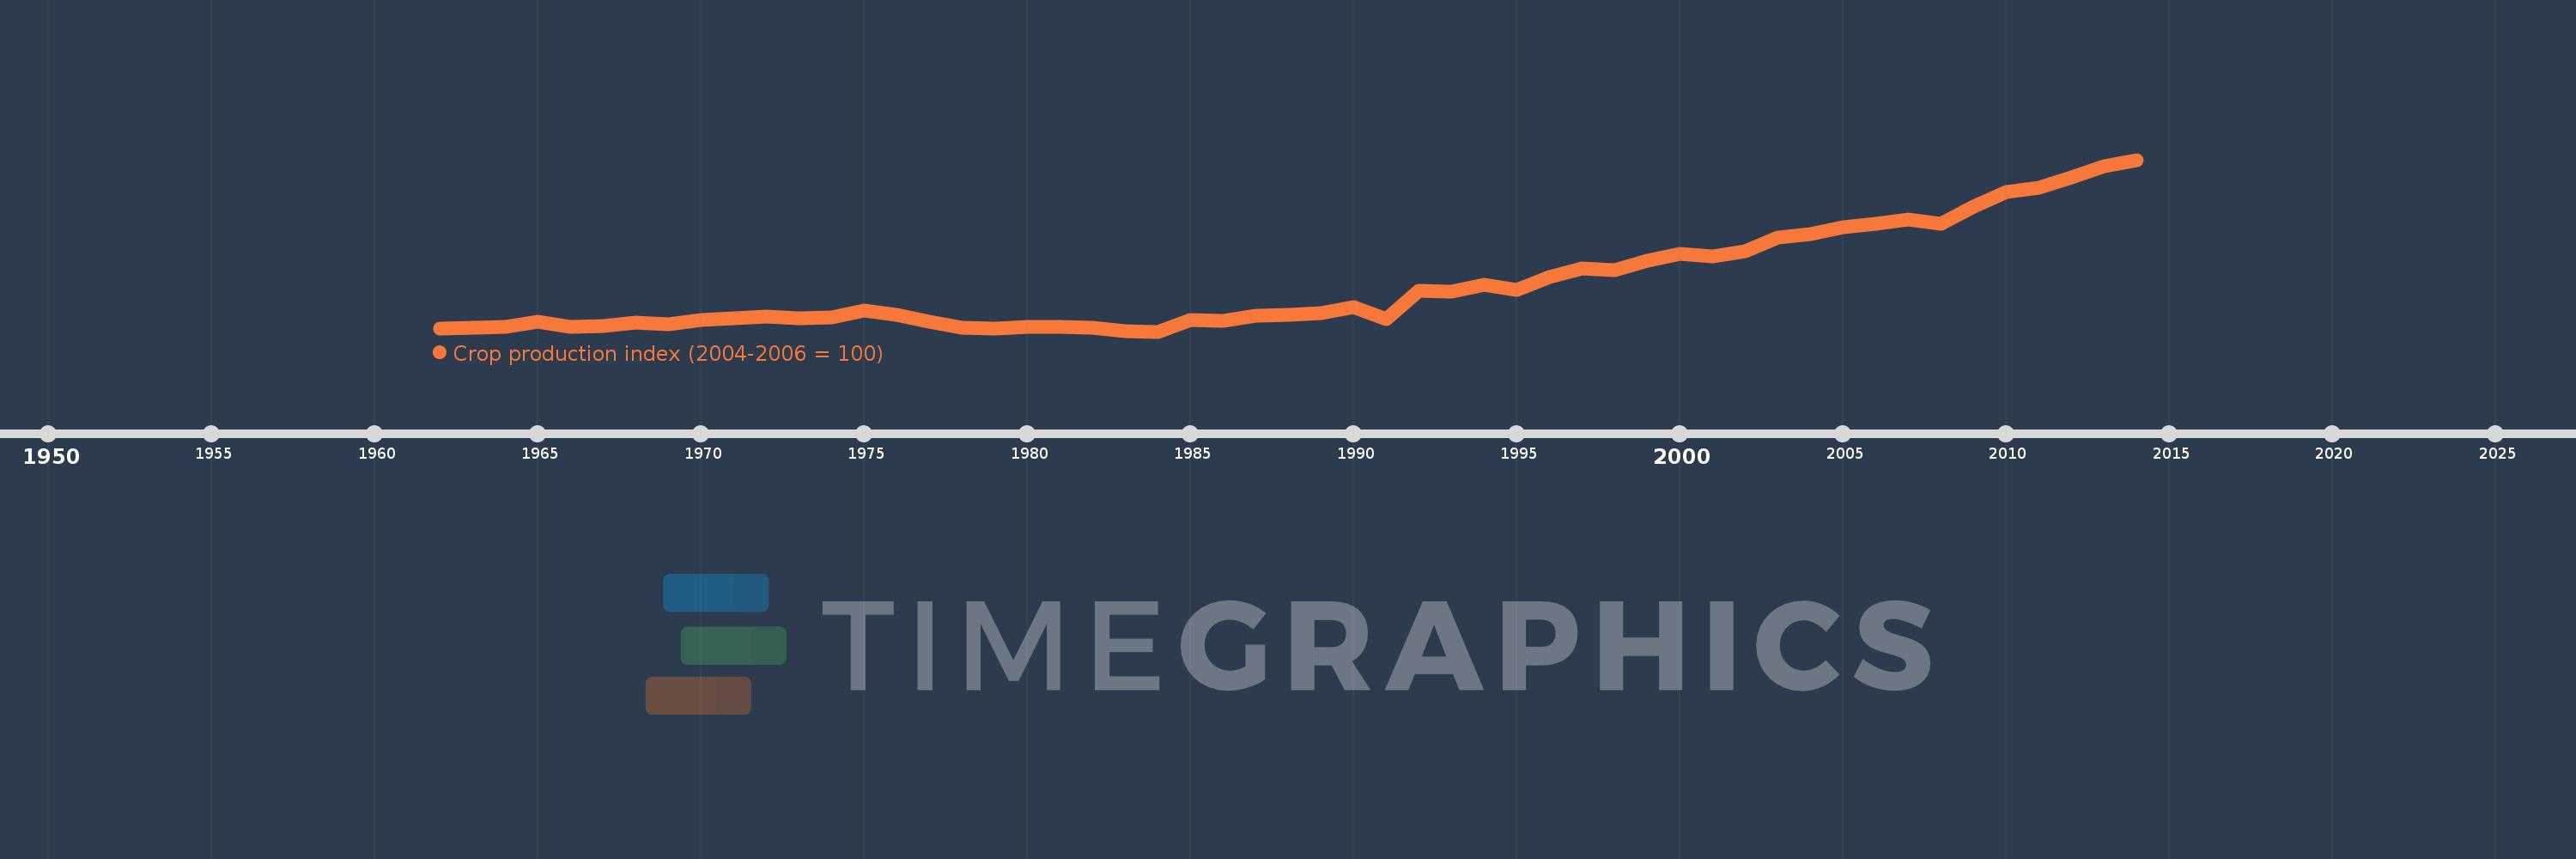
Crop production index (2004-2006 = 100)
2014,2013,2012,2011,2010,2009,2008,2007,2006,2005,2004,2003,2002,2001,2000,1999,1998,1997,1996,1995,1994,1993,1992,1991,1990,1989,1988,1987,1986,1985,1984,1983,1982,1981,1980,1979,1978,1977,1976,1975,1974,1973,1972,1971,1970,1969,1968,1967,1966,1965,1964,1963,1962
Cette statistique dans les autres pays:
AfghanistanAlbaniaAlgeriaAmerican SamoaAngolaAntigua and BarbudaArab WorldArgentinaArmeniaAustraliaAustriaAzerbaijanBahamas, TheBahrainBangladeshBarbadosBelarusBelgiumBelizeBeninBermudaBhutanBoliviaBosnia and HerzegovinaBotswanaBrazilBritish Virgin IslandsBrunei DarussalamBulgariaBurkina FasoBurundiCabo VerdeCambodiaCameroonCanadaCaribbean small statesCayman IslandsCentral African RepublicCentral Europe and the BalticsChadChileChinaColombiaComorosCongo, Dem. Rep.Congo, Rep.Costa RicaCote d'IvoireCroatiaCubaCyprusCzech RepublicDenmarkDjiboutiDominicaDominican RepublicEarly-demographic dividendEast Asia & PacificEast Asia & Pacific (excluding high income)East Asia & Pacific (IDA & IBRD countries)EcuadorEgypt, Arab Rep.El SalvadorEquatorial GuineaEritreaEstoniaEthiopiaEuro areaEurope & Central AsiaEurope & Central Asia (excluding high income)Europe & Central Asia (IDA & IBRD countries)European UnionFaroe IslandsFijiFinlandFragile and conflict affected situationsFranceFrench PolynesiaGabonGambia, TheGeorgiaGermanyGhanaGreeceGrenadaGuamGuatemalaGuineaGuinea-BissauGuyanaHaitiHeavily indebted poor countries (HIPC)High incomeHondurasHong Kong SAR, ChinaHungaryIBRD onlyIcelandIDA & IBRD totalIDA blendIDA onlyIDA totalIndiaIndonesiaIran, Islamic Rep.IraqIrelandIsraelItalyJamaicaJapanJordanKazakhstanKenyaKiribatiKorea, Dem. People’s Rep.Korea, Rep.KuwaitKyrgyz RepublicLao PDRLate-demographic dividendLatin America & Caribbean Latin America & Caribbean (excluding high income)Latin America & the Caribbean (IDA & IBRD countries)LatviaLeast developed countries: UN classificationLebanonLesothoLiberiaLibyaLiechtensteinLithuaniaLow & middle incomeLow incomeLower middle incomeLuxembourgMacao SAR, ChinaMacedonia, FYRMadagascarMalawiMalaysiaMaldivesMaliMaltaMarshall IslandsMauritaniaMauritiusMexicoMicronesia, Fed. Sts.Middle East & North AfricaMiddle East & North Africa (excluding high income)Middle East & North Africa (IDA & IBRD countries)Middle incomeMoldovaMongoliaMontenegroMoroccoMozambiqueMyanmarNamibiaNauruNepalNetherlandsNew CaledoniaNew ZealandNicaraguaNigerNigeriaNorth AmericaNorwayOECD membersOmanOther small statesPacific island small statesPakistanPanamaPapua New GuineaParaguayPeruPhilippinesPolandPortugalPost-demographic dividendPre-demographic dividendPuerto RicoQatarRomaniaRussian FederationRwandaSamoaSao Tome and PrincipeSaudi ArabiaSenegalSerbiaSeychellesSierra LeoneSingaporeSlovak RepublicSloveniaSmall statesSolomon IslandsSomaliaSouth AfricaSouth AsiaSouth Asia (IDA & IBRD)SpainSri LankaSt. Kitts and NevisSt. LuciaSt. Vincent and the GrenadinesSub-Saharan Africa Sub-Saharan Africa (excluding high income)Sub-Saharan Africa (IDA & IBRD countries)SudanSurinameSwazilandSwedenSwitzerlandSyrian Arab RepublicTajikistanTanzaniaThailandTimor-LesteTogoTongaTrinidad and TobagoTunisiaTurkeyTurkmenistanTuvaluUgandaUkraineUnited Arab EmiratesUnited KingdomUnited StatesUpper middle incomeUruguayUzbekistanVanuatuVenezuela, RBVietnamWest Bank and GazaWorldYemen, Rep.ZambiaZimbabwe La ligne de temps
Cette échelle de temps montre un graphique de 1962 année à 2014 année Ghana. Les données jusqu'à 1961 année ne sont pas présentés. Quantité d'observations actuelles selon dates: 53.
Source (désignation):
Les indicateurs du développement mondiale
Source (organisation):
Food and Agriculture Organization, electronic files and web site.
Catégories:
Agriculture & Rural Development
Dernière mise à jour
23 avr. 2017
Les indicateurs de changement de valeurs selon les années
Maximum:
144.25
1 janv. 2014
Pour la date d''observation
Valeur
Changement absolu
Le changement par rapport à la valeur précédente
1 janv. 1962
27.23
+27.23
0.0%
1 janv. 1963
27.59
+0.36
1.32%
1 janv. 1964
28.1
+0.51
1.85%
1 janv. 1965
31.95
+3.85
13.7%
1 janv. 1966
28.51
-3.44
-10.77%
1 janv. 1967
28.9
+0.39
1.37%
1 janv. 1968
31.56
+2.66
9.2%
1 janv. 1969
30.32
-1.24
-3.93%
1 janv. 1970
32.85
+2.53
8.34%
1 janv. 1971
34.22
+1.37
4.17%
1 janv. 1972
35.65
+1.43
4.18%
1 janv. 1973
34.55
-1.1
-3.09%
1 janv. 1974
34.88
+0.33
0.96%
1 janv. 1975
39.73
+4.85
13.9%
1 janv. 1976
36.69
-3.04
-7.65%
1 janv. 1977
31.98
-4.71
-12.84%
1 janv. 1978
27.75
-4.23
-13.23%
1 janv. 1979
27.13
-0.62
-2.23%
1 janv. 1980
28.32
+1.19
4.39%
1 janv. 1981
28.26
-0.06
-0.21%
1 janv. 1982
27.51
-0.75
-2.65%
1 janv. 1983
25.16
-2.35
-8.54%
1 janv. 1984
25.1
-0.06
-0.24%
1 janv. 1985
33.19
+8.09
32.23%
1 janv. 1986
32.66
-0.53
-1.6%
1 janv. 1987
35.92
+3.26
9.98%
1 janv. 1988
36.69
+0.77
2.14%
1 janv. 1989
37.78
+1.09
2.97%
1 janv. 1990
42.25
+4.47
11.83%
1 janv. 1991
34.03
-8.22
-19.46%
1 janv. 1992
53.58
+19.55
57.45%
1 janv. 1993
52.89
-0.69
-1.29%
1 janv. 1994
57.44
+4.55
8.6%
1 janv. 1995
54.06
-3.38
-5.88%
1 janv. 1996
62.91
+8.85
16.37%
1 janv. 1997
68.98
+6.07
9.65%
1 janv. 1998
67.59
-1.39
-2.02%
1 janv. 1999
74.39
+6.8
10.06%
1 janv. 2000
79.22
+4.83
6.49%
1 janv. 2001
77.33
-1.89
-2.39%
1 janv. 2002
80.69
+3.36
4.35%
1 janv. 2003
90.34
+9.65
11.96%
1 janv. 2004
92.98
+2.64
2.92%
1 janv. 2005
97.33
+4.35
4.68%
1 janv. 2006
99.86
+2.53
2.6%
1 janv. 2007
102.81
+2.95
2.95%
1 janv. 2008
100.08
-2.73
-2.66%
1 janv. 2009
112.02
+11.94
11.93%
1 janv. 2010
122.06
+10.04
8.96%
1 janv. 2011
124.67
+2.61
2.14%
1 janv. 2012
131.92
+7.25
5.82%
1 janv. 2013
139.58
+7.66
5.81%
1 janv. 2014
144.25
+4.67
3.35%
Classement des pays selon les statistiques actuelles par années


Commentaires: