29
/fr/
fr
AIzaSyAYiBZKx7MnpbEhh9jyipgxe19OcubqV5w
April 1, 2024
231405
Rwanda
RWA
true
2
1
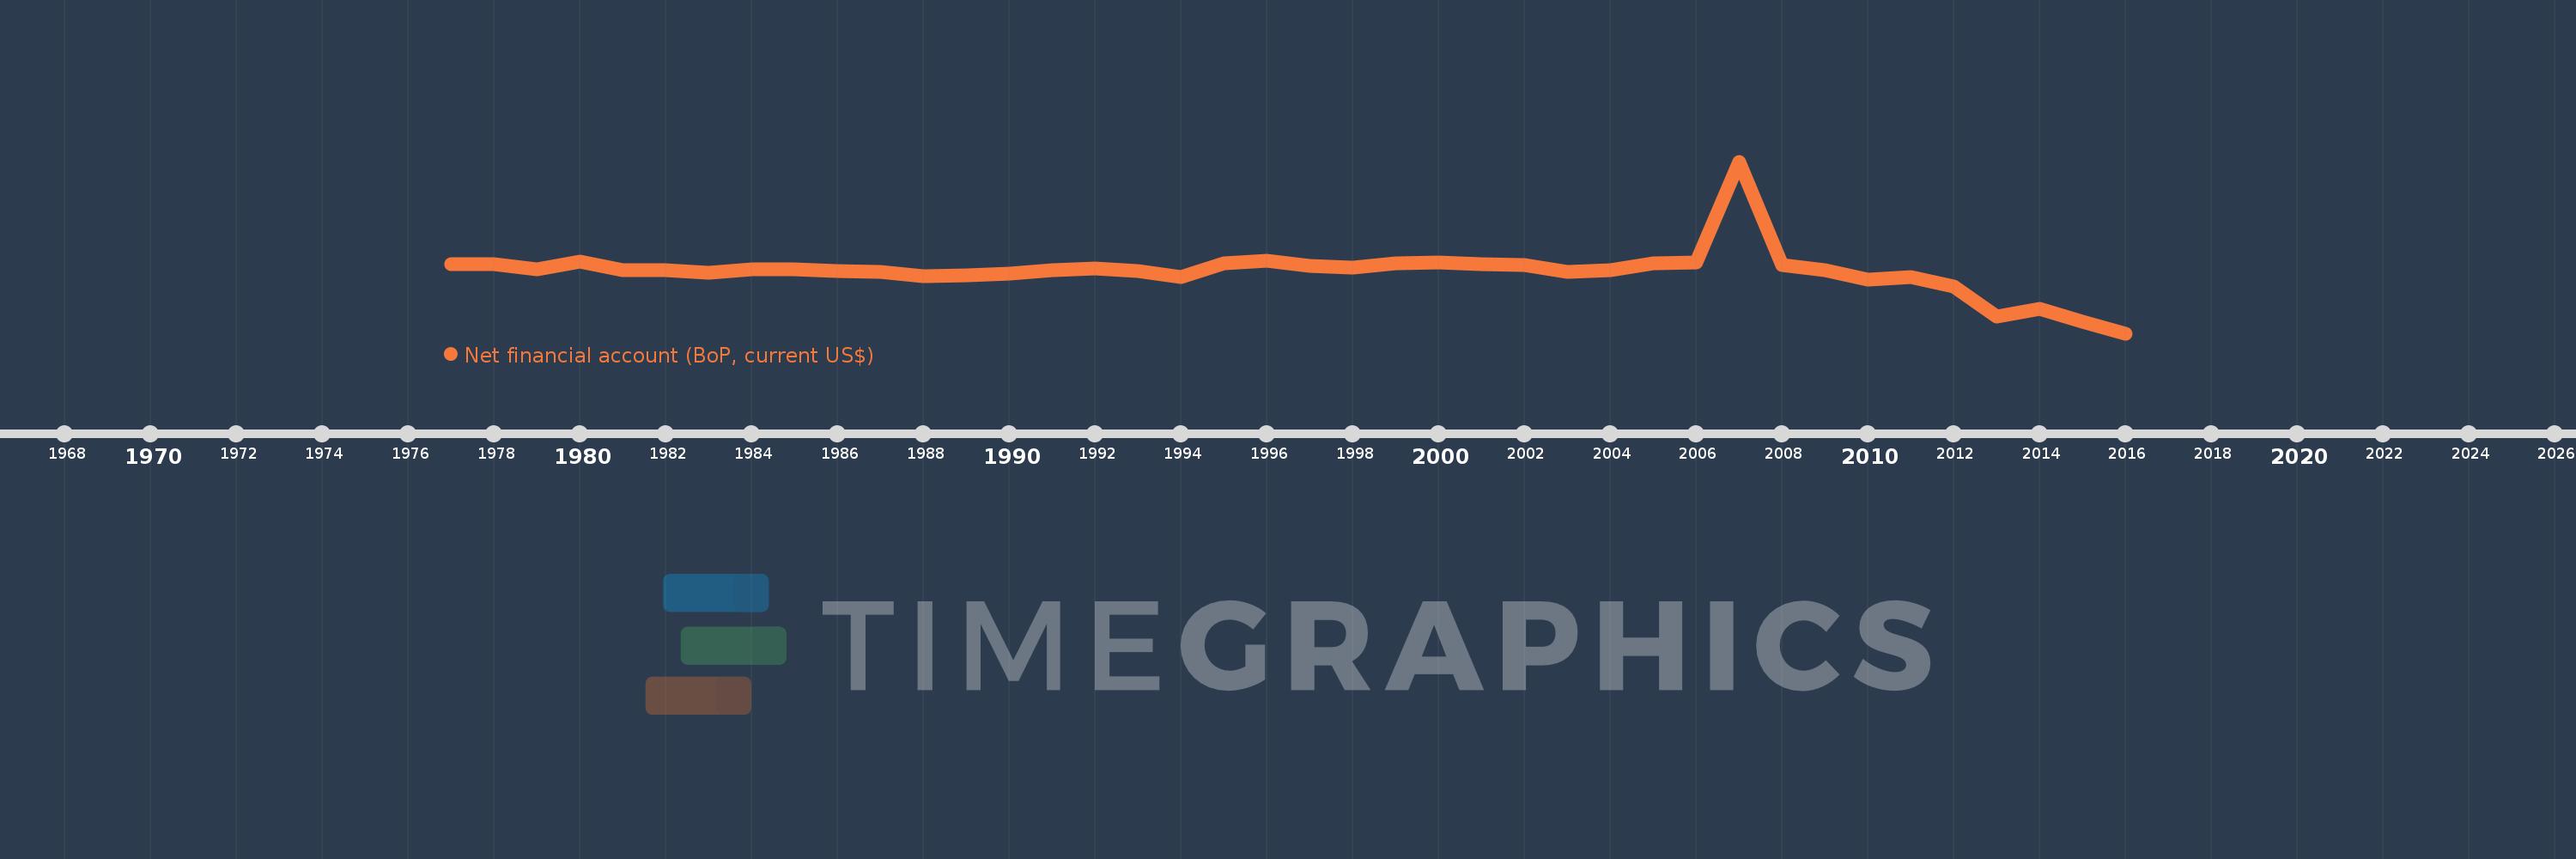
Net financial account (BoP, current US$)
2016,2015,2014,2013,2012,2011,2010,2009,2008,2007,2006,2005,2004,2003,2002,2001,2000,1999,1998,1997,1996,1995,1994,1993,1992,1991,1990,1989,1988,1987,1986,1985,1984,1983,1982,1981,1980,1979,1978,1977
Cette statistique dans les autres pays:
AfghanistanAlbaniaAlgeriaAngolaAntigua and BarbudaArgentinaArmeniaArubaAustraliaAustriaAzerbaijanBahamas, TheBahrainBangladeshBarbadosBelarusBelgiumBelizeBeninBermudaBhutanBoliviaBosnia and HerzegovinaBotswanaBrazilBrunei DarussalamBulgariaBurkina FasoBurundiCabo VerdeCambodiaCameroonCanadaCentral African RepublicChadChileChinaColombiaComorosCongo, Dem. Rep.Congo, Rep.Costa RicaCote d'IvoireCroatiaCuracaoCyprusCzech RepublicDenmarkDjiboutiDominicaDominican RepublicEcuadorEgypt, Arab Rep.El SalvadorEquatorial GuineaEritreaEstoniaEthiopiaEuro areaFijiFinlandFranceFrench PolynesiaGabonGambia, TheGeorgiaGermanyGhanaGreeceGrenadaGuatemalaGuineaGuinea-BissauGuyanaHaitiHondurasHong Kong SAR, ChinaHungaryIcelandIndiaIndonesiaIran, Islamic Rep.IraqIrelandIsraelItalyJamaicaJapanJordanKazakhstanKenyaKiribatiKorea, Rep.KosovoKuwaitKyrgyz RepublicLao PDRLatviaLebanonLesothoLiberiaLibyaLithuaniaLuxembourgMacao SAR, ChinaMacedonia, FYRMadagascarMalawiMalaysiaMaldivesMaliMaltaMarshall IslandsMauritaniaMauritiusMexicoMicronesia, Fed. Sts.MoldovaMongoliaMontenegroMoroccoMozambiqueMyanmarNamibiaNepalNetherlandsNew CaledoniaNew ZealandNicaraguaNigerNigeriaNorwayOmanPakistanPalauPanamaPapua New GuineaParaguayPeruPhilippinesPolandPortugalQatarRomaniaRussian FederationRwandaSamoaSao Tome and PrincipeSaudi ArabiaSenegalSerbiaSeychellesSierra LeoneSingaporeSint Maarten (Dutch part)Slovak RepublicSloveniaSolomon IslandsSouth AfricaSouth SudanSpainSri LankaSt. Kitts and NevisSt. LuciaSt. Vincent and the GrenadinesSudanSurinameSwazilandSwedenSwitzerlandSyrian Arab RepublicTajikistanTanzaniaThailandTimor-LesteTogoTongaTrinidad and TobagoTunisiaTurkeyTuvaluUgandaUkraineUnited KingdomUnited StatesUruguayVanuatuVenezuela, RBVietnamWest Bank and GazaYemen, Rep.ZambiaZimbabwe La ligne de temps
Cette échelle de temps montre un graphique de 1977 année à 2016 année Rwanda. Les données jusqu'à 1976 année ne sont pas présentés. Quantité d'observations actuelles selon dates: 40.
Source (désignation):
Les indicateurs du développement mondiale
Source (organisation):
International Monetary Fund, Balance of Payments Statistics Yearbook and data files.
Catégories:
Economy & Growth
Dernière mise à jour
23 avr. 2017
Les indicateurs de changement de valeurs selon les années
Minimum:
-823.608 mln.
1 janv. 2016
Maximum:
1.266 mds
1 janv. 2007
Pour la date d''observation
Valeur
Changement absolu
Le changement par rapport à la valeur précédente
1 janv. 1977
15.493 mln.
+15.493 mln.
0.0%
1 janv. 1978
15.177 mln.
-315.945 milles
-2.04%
1 janv. 1979
-48.129 mln.
-63.306 mln.
-417.12%
1 janv. 1980
49.74 mln.
+97.869 mln.
-203.35%
1 janv. 1981
-53.623 mln.
-103.363 mln.
-207.81%
1 janv. 1982
-59.006 mln.
-5.383 mln.
10.04%
1 janv. 1983
-89.372 mln.
-30.366 mln.
51.46%
1 janv. 1984
-48.858 mln.
+40.514 mln.
-45.33%
1 janv. 1985
-44.646 mln.
+4.212 mln.
-8.62%
1 janv. 1986
-67.697 mln.
-23.051 mln.
51.63%
1 janv. 1987
-73.741 mln.
-6.043 mln.
8.93%
1 janv. 1988
-133.198 mln.
-59.457 mln.
80.63%
1 janv. 1989
-118.643 mln.
+14.555 mln.
-10.93%
1 janv. 1990
-99.852 mln.
+18.792 mln.
-15.84%
1 janv. 1991
-55.531 mln.
+44.32 mln.
-44.39%
1 janv. 1992
-33.979 mln.
+21.552 mln.
-38.81%
1 janv. 1993
-66.101 mln.
-32.122 mln.
94.53%
1 janv. 1994
-138.543 mln.
-72.442 mln.
109.59%
1 janv. 1995
25.515 mln.
+164.057 mln.
-118.42%
1 janv. 1996
61.614 mln.
+36.099 mln.
141.48%
1 janv. 1997
-4.404 mln.
-66.017 mln.
-107.15%
1 janv. 1998
-20.281 mln.
-15.877 mln.
360.53%
1 janv. 1999
28.66 mln.
+48.94 mln.
-241.31%
1 janv. 2000
39.348 mln.
+10.689 mln.
37.29%
1 janv. 2001
14.084 mln.
-25.264 mln.
-64.21%
1 janv. 2002
7.699 mln.
-6.385 mln.
-45.34%
1 janv. 2003
-75.57 mln.
-83.269 mln.
-1.08 milles%
1 janv. 2004
-57.451 mln.
+18.119 mln.
-23.98%
1 janv. 2005
32.392 mln.
+89.843 mln.
-156.38%
1 janv. 2006
37.754 mln.
+5.362 mln.
16.55%
1 janv. 2007
1.266 mds
+1.228 mds
3.25 milles%
1 janv. 2008
6.004 mln.
-1.26 mds
-99.53%
1 janv. 2009
-51.755 mln.
-57.759 mln.
-961.97%
1 janv. 2010
-173.313 mln.
-121.558 mln.
234.87%
1 janv. 2011
-141.654 mln.
+31.659 mln.
-18.27%
1 janv. 2012
-251.295 mln.
-109.641 mln.
77.4%
1 janv. 2013
-623.68 mln.
-372.385 mln.
148.19%
1 janv. 2014
-522.769 mln.
+100.911 mln.
-16.18%
1 janv. 2015
-681.767 mln.
-158.998 mln.
30.41%
1 janv. 2016
-823.608 mln.
-141.841 mln.
20.8%
Classement des pays selon les statistiques actuelles par années


Commentaires: