29
/fr/
fr
AIzaSyAYiBZKx7MnpbEhh9jyipgxe19OcubqV5w
April 1, 2024
201942
Morocco
MAR
true
2
1
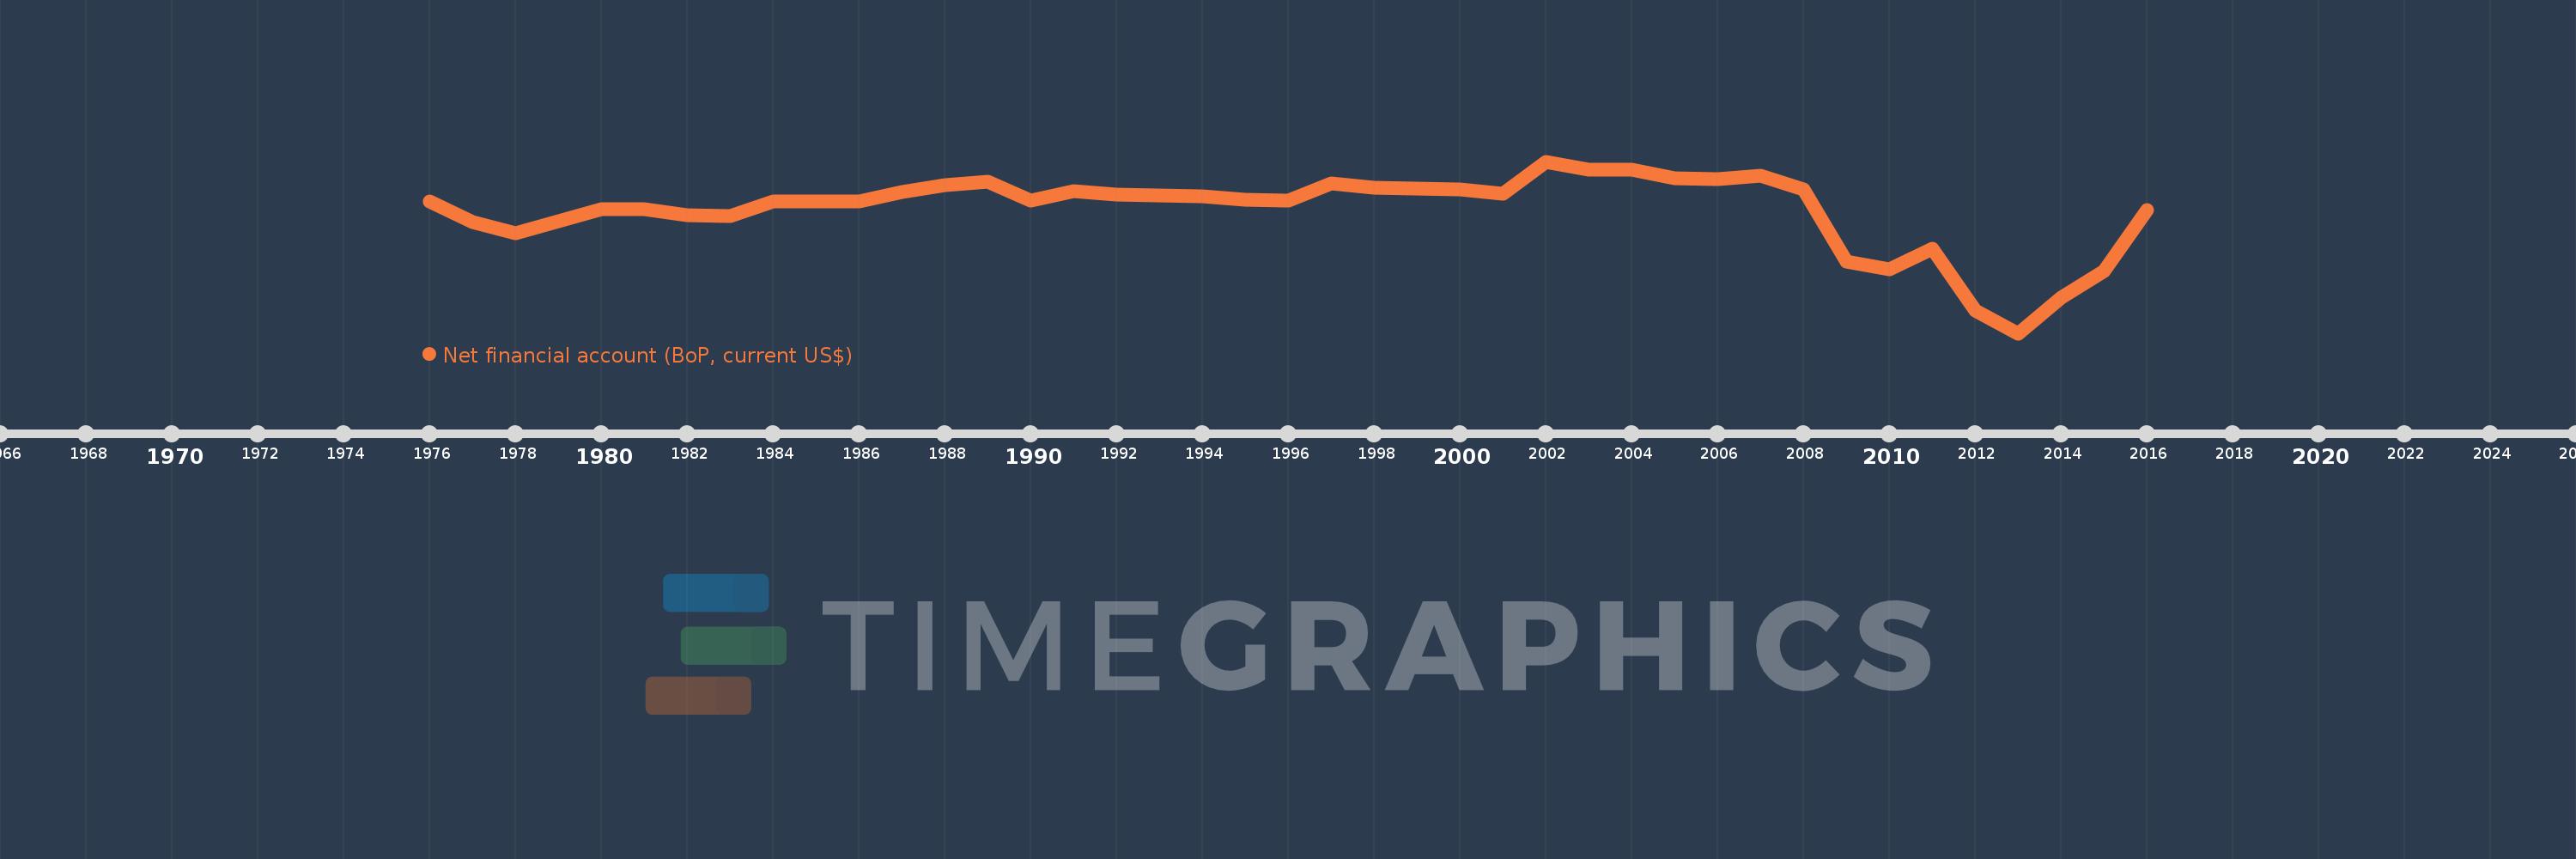
Net financial account (BoP, current US$)
2016,2015,2014,2013,2012,2011,2010,2009,2008,2007,2006,2005,2004,2003,2002,2001,2000,1999,1998,1997,1996,1995,1994,1993,1992,1991,1990,1989,1988,1987,1986,1985,1984,1983,1982,1981,1980,1979,1978,1977,1976
Cette statistique dans les autres pays:
AfghanistanAlbaniaAlgeriaAngolaAntigua and BarbudaArgentinaArmeniaArubaAustraliaAustriaAzerbaijanBahamas, TheBahrainBangladeshBarbadosBelarusBelgiumBelizeBeninBermudaBhutanBoliviaBosnia and HerzegovinaBotswanaBrazilBrunei DarussalamBulgariaBurkina FasoBurundiCabo VerdeCambodiaCameroonCanadaCentral African RepublicChadChileChinaColombiaComorosCongo, Dem. Rep.Congo, Rep.Costa RicaCote d'IvoireCroatiaCuracaoCyprusCzech RepublicDenmarkDjiboutiDominicaDominican RepublicEcuadorEgypt, Arab Rep.El SalvadorEquatorial GuineaEritreaEstoniaEthiopiaEuro areaFijiFinlandFranceFrench PolynesiaGabonGambia, TheGeorgiaGermanyGhanaGreeceGrenadaGuatemalaGuineaGuinea-BissauGuyanaHaitiHondurasHong Kong SAR, ChinaHungaryIcelandIndiaIndonesiaIran, Islamic Rep.IraqIrelandIsraelItalyJamaicaJapanJordanKazakhstanKenyaKiribatiKorea, Rep.KosovoKuwaitKyrgyz RepublicLao PDRLatviaLebanonLesothoLiberiaLibyaLithuaniaLuxembourgMacao SAR, ChinaMacedonia, FYRMadagascarMalawiMalaysiaMaldivesMaliMaltaMarshall IslandsMauritaniaMauritiusMexicoMicronesia, Fed. Sts.MoldovaMongoliaMontenegroMoroccoMozambiqueMyanmarNamibiaNepalNetherlandsNew CaledoniaNew ZealandNicaraguaNigerNigeriaNorwayOmanPakistanPalauPanamaPapua New GuineaParaguayPeruPhilippinesPolandPortugalQatarRomaniaRussian FederationRwandaSamoaSao Tome and PrincipeSaudi ArabiaSenegalSerbiaSeychellesSierra LeoneSingaporeSint Maarten (Dutch part)Slovak RepublicSloveniaSolomon IslandsSouth AfricaSouth SudanSpainSri LankaSt. Kitts and NevisSt. LuciaSt. Vincent and the GrenadinesSudanSurinameSwazilandSwedenSwitzerlandSyrian Arab RepublicTajikistanTanzaniaThailandTimor-LesteTogoTongaTrinidad and TobagoTunisiaTurkeyTuvaluUgandaUkraineUnited KingdomUnited StatesUruguayVanuatuVenezuela, RBVietnamWest Bank and GazaYemen, Rep.ZambiaZimbabwe La ligne de temps
Cette échelle de temps montre un graphique de 1976 année à 2016 année Morocco. Les données jusqu'à 1975 année ne sont pas présentés. Quantité d'observations actuelles selon dates: 41.
Source (désignation):
Les indicateurs du développement mondiale
Source (organisation):
International Monetary Fund, Balance of Payments Statistics Yearbook and data files.
Catégories:
Economy & Growth
Dernière mise à jour
23 avr. 2017
Les indicateurs de changement de valeurs selon les années
Minimum:
-9.8 mds
1 janv. 2013
Maximum:
1.837 mds
1 janv. 2002
Pour la date d''observation
Valeur
Changement absolu
Le changement par rapport à la valeur précédente
1 janv. 1976
-857.004 mln.
-857.004 mln.
0.0%
1 janv. 1977
-2.266 mds
-1.409 mds
164.38%
1 janv. 1978
-3.025 mds
-758.903 mln.
33.49%
1 janv. 1979
-2.215 mds
+809.682 mln.
-26.77%
1 janv. 1980
-1.412 mds
+802.849 mln.
-36.25%
1 janv. 1981
-1.385 mds
+27.427 mln.
-1.94%
1 janv. 1982
-1.773 mds
-387.839 mln.
28.01%
1 janv. 1983
-1.87 mds
-97.471 mln.
5.5%
1 janv. 1984
-862.99 mln.
+1.007 mds
-53.85%
1 janv. 1985
-884.85 mln.
-21.86 mln.
2.53%
1 janv. 1986
-847.802 mln.
+37.048 mln.
-4.19%
1 janv. 1987
-247.462 mln.
+600.34 mln.
-70.81%
1 janv. 1988
215.451 mln.
+462.912 mln.
-187.06%
1 janv. 1989
487.261 mln.
+271.811 mln.
126.16%
1 janv. 1990
-800.762 mln.
-1.288 mds
-264.34%
1 janv. 1991
-191.693 mln.
+609.068 mln.
-76.06%
1 janv. 1992
-417.387 mln.
-225.694 mln.
117.74%
1 janv. 1993
-438.517 mln.
-21.13 mln.
5.06%
1 janv. 1994
-524.912 mln.
-86.395 mln.
19.7%
1 janv. 1995
-765.535 mln.
-240.623 mln.
45.84%
1 janv. 1996
-799.041 mln.
-33.506 mln.
4.38%
1 janv. 1997
334.906 mln.
+1.134 mds
-141.91%
1 janv. 1998
83.131 mln.
-251.775 mln.
-75.18%
1 janv. 1999
6.487 mln.
-76.645 mln.
-92.2%
1 janv. 2000
-49.162 mln.
-55.648 mln.
-857.89%
1 janv. 2001
-365.795 mln.
-316.633 mln.
644.07%
1 janv. 2002
1.837 mds
+2.203 mds
-602.22%
1 janv. 2003
1.282 mds
-554.827 mln.
-30.2%
1 janv. 2004
1.268 mds
-13.896 mln.
-1.08%
1 janv. 2005
678.133 mln.
-590.253 mln.
-46.54%
1 janv. 2006
632.093 mln.
-46.04 mln.
-6.79%
1 janv. 2007
887.757 mln.
+255.664 mln.
40.45%
1 janv. 2008
-25.669 mln.
-913.427 mln.
-102.89%
1 janv. 2009
-4.943 mds
-4.917 mds
19.16 milles%
1 janv. 2010
-5.493 mds
-550.044 mln.
11.13%
1 janv. 2011
-4.085 mds
+1.408 mds
-25.63%
1 janv. 2012
-8.243 mds
-4.159 mds
101.81%
1 janv. 2013
-9.8 mds
-1.557 mds
18.89%
1 janv. 2014
-7.408 mds
+2.392 mds
-24.41%
1 janv. 2015
-5.59 mds
+1.818 mds
-24.54%
1 janv. 2016
-1.473 mds
+4.117 mds
-73.65%
Classement des pays selon les statistiques actuelles par années


Commentaires: