29
/fr/
fr
AIzaSyAYiBZKx7MnpbEhh9jyipgxe19OcubqV5w
April 1, 2024
224512
Poland
POL
true
2
1
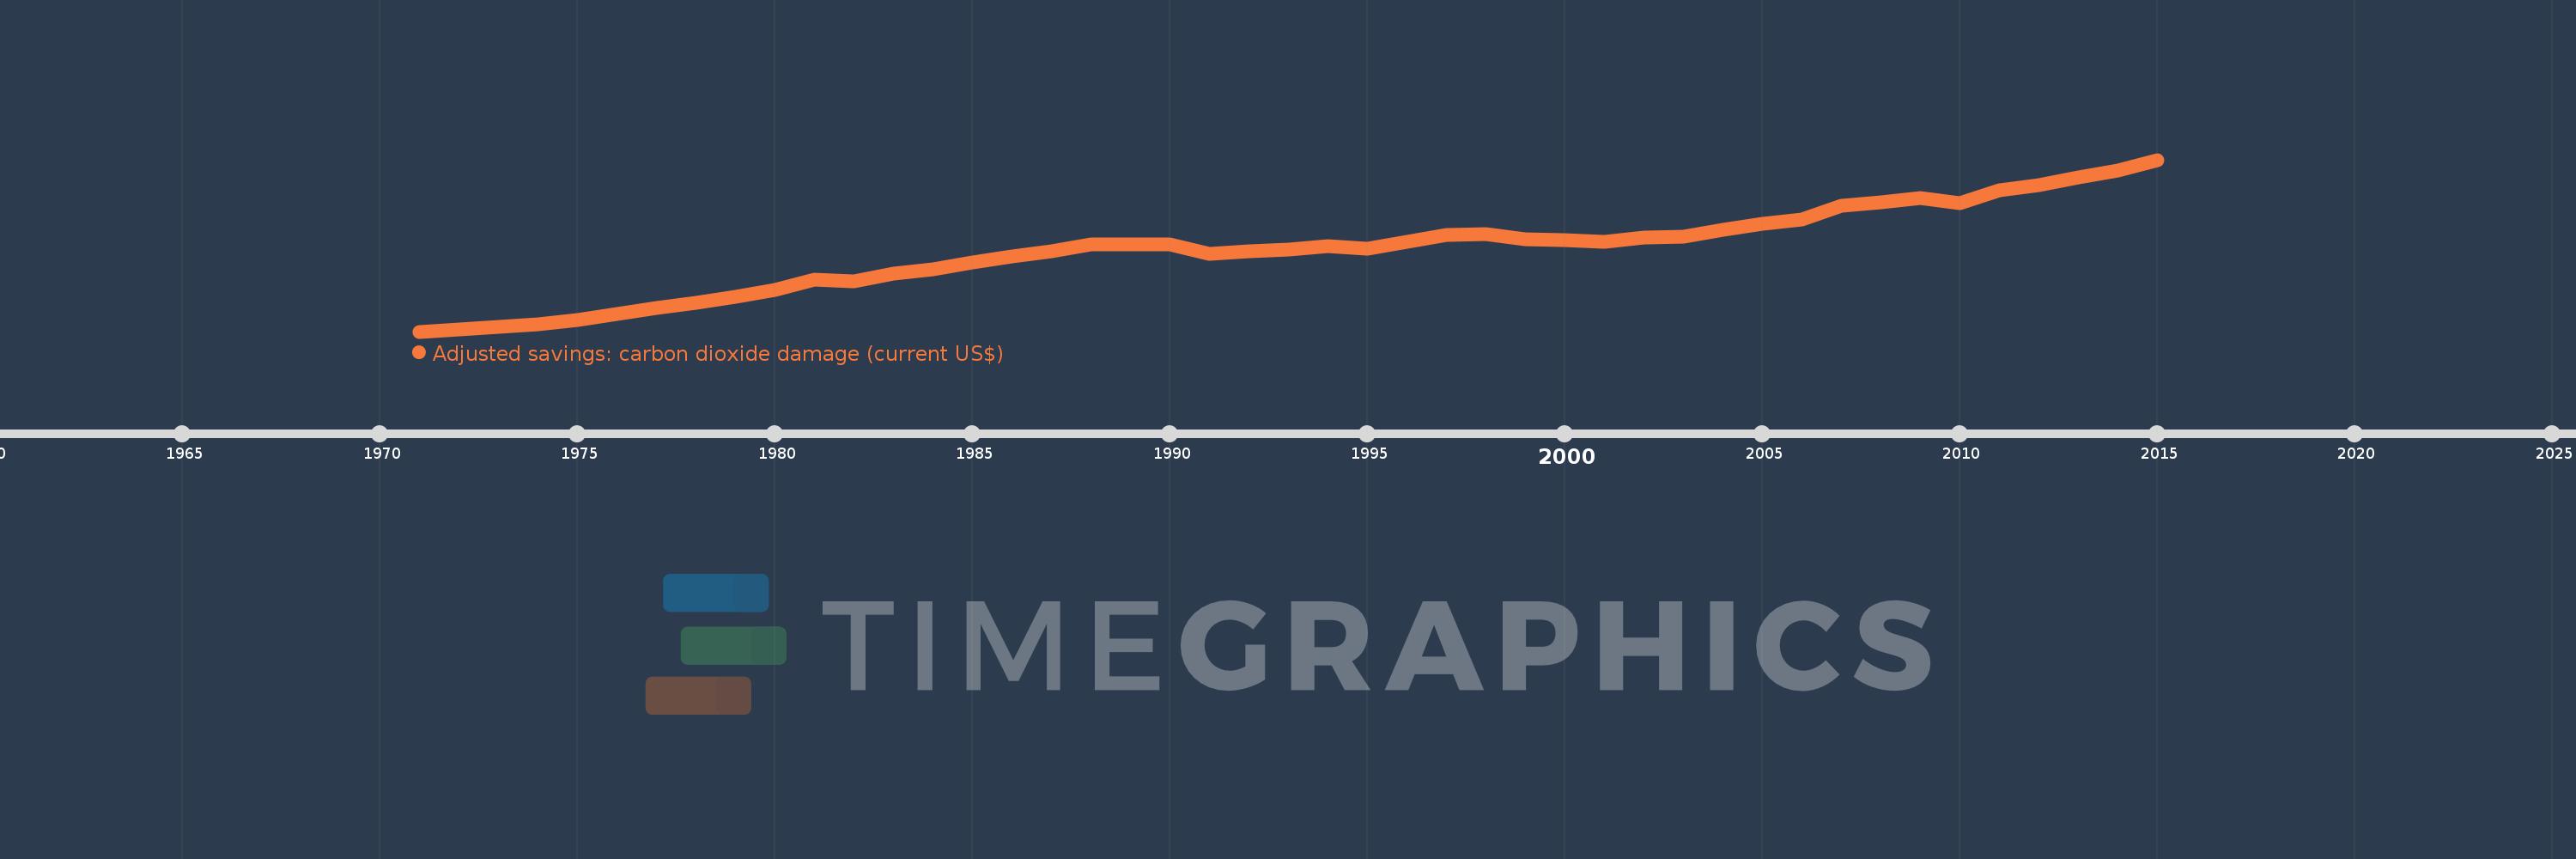
Adjusted savings: carbon dioxide damage (current US$)
2015,2014,2013,2012,2011,2010,2009,2008,2007,2006,2005,2004,2003,2002,2001,2000,1999,1998,1997,1996,1995,1994,1993,1992,1991,1990,1989,1988,1987,1986,1985,1984,1983,1982,1981,1980,1979,1978,1977,1976,1975,1974,1973,1972,1971
Cette statistique dans les autres pays:
AfghanistanAlbaniaAlgeriaAndorraAngolaAntigua and BarbudaArgentinaArmeniaArubaAustraliaAustriaAzerbaijanBahamas, TheBahrainBangladeshBarbadosBelarusBelgiumBelizeBeninBermudaBhutanBoliviaBosnia and HerzegovinaBotswanaBrazilBrunei DarussalamBulgariaBurkina FasoBurundiCabo VerdeCambodiaCameroonCanadaCayman IslandsCentral African RepublicChadChileChinaColombiaComorosCongo, Dem. Rep.Congo, Rep.Costa RicaCote d'IvoireCroatiaCubaCyprusCzech RepublicDenmarkDjiboutiDominicaDominican RepublicEcuadorEgypt, Arab Rep.El SalvadorEquatorial GuineaEritreaEstoniaEthiopiaFaroe IslandsFijiFinlandFranceFrench PolynesiaGabonGambia, TheGeorgiaGermanyGhanaGibraltarGreeceGreenlandGrenadaGuatemalaGuineaGuinea-BissauGuyanaHaitiHondurasHong Kong SAR, ChinaHungaryIcelandIndiaIndonesiaIran, Islamic Rep.IraqIrelandIsraelItalyJamaicaJapanJordanKazakhstanKenyaKiribatiKorea, Dem. People’s Rep.Korea, Rep.KuwaitKyrgyz RepublicLao PDRLatviaLebanonLesothoLiberiaLibyaLiechtensteinLithuaniaLuxembourgMacao SAR, ChinaMacedonia, FYRMadagascarMalawiMalaysiaMaldivesMaliMaltaMarshall IslandsMauritaniaMauritiusMexicoMicronesia, Fed. Sts.MoldovaMongoliaMontenegroMoroccoMozambiqueMyanmarNamibiaNepalNetherlandsNew CaledoniaNew ZealandNicaraguaNigerNigeriaNorwayOmanPakistanPalauPanamaPapua New GuineaParaguayPeruPhilippinesPolandPortugalQatarRomaniaRussian FederationRwandaSamoaSao Tome and PrincipeSaudi ArabiaSenegalSerbiaSeychellesSierra LeoneSingaporeSlovak RepublicSloveniaSolomon IslandsSomaliaSouth AfricaSpainSri LankaSt. Kitts and NevisSt. LuciaSt. Vincent and the GrenadinesSudanSurinameSwazilandSwedenSwitzerlandSyrian Arab RepublicTajikistanTanzaniaThailandTimor-LesteTogoTongaTrinidad and TobagoTunisiaTurkeyTurkmenistanTurks and Caicos IslandsUgandaUkraineUnited Arab EmiratesUnited KingdomUnited StatesUruguayUzbekistanVanuatuVenezuela, RBVietnamWest Bank and GazaYemen, Rep.ZambiaZimbabwe La ligne de temps
Cette échelle de temps montre un graphique de 1971 année à 2015 année Poland. Les données jusqu'à 1970 année ne sont pas présentés. Quantité d'observations actuelles selon dates: 45.
Source (désignation):
Les indicateurs du développement mondiale
Source (organisation):
World Bank staff estimates based on Samuel Fankhauser's "Valuing Climate Change: The Economics of the Greenhouse" (1995).
Catégories:
Economy & Growth, Environment
Dernière mise à jour
23 avr. 2017
Les indicateurs de changement de valeurs selon les années
Minimum:
406.366 mln.
1 janv. 1971
Maximum:
3.535 mds
1 janv. 2015
Pour la date d''observation
Valeur
Changement absolu
Le changement par rapport à la valeur précédente
1 janv. 1971
406.366 mln.
+406.366 mln.
0.0%
1 janv. 1972
444.513 mln.
+38.147 mln.
9.39%
1 janv. 1973
494.232 mln.
+49.719 mln.
11.19%
1 janv. 1974
537.119 mln.
+42.888 mln.
8.68%
1 janv. 1975
611.186 mln.
+74.067 mln.
13.79%
1 janv. 1976
731.504 mln.
+120.318 mln.
19.69%
1 janv. 1977
829.529 mln.
+98.025 mln.
13.4%
1 janv. 1978
935.983 mln.
+106.455 mln.
12.83%
1 janv. 1979
1.045 mds
+109.009 mln.
11.65%
1 janv. 1980
1.172 mds
+127.202 mln.
12.17%
1 janv. 1981
1.357 mds
+185.27 mln.
15.81%
1 janv. 1982
1.325 mds
-32.029 mln.
-2.36%
1 janv. 1983
1.466 mds
+140.961 mln.
10.64%
1 janv. 1984
1.543 mds
+76.278 mln.
5.2%
1 janv. 1985
1.66 mds
+117.723 mln.
7.63%
1 janv. 1986
1.782 mds
+121.231 mln.
7.3%
1 janv. 1987
1.87 mds
+88.113 mln.
4.95%
1 janv. 1988
1.991 mds
+121.511 mln.
6.5%
1 janv. 1989
1.998 mds
+7.107 mln.
0.36%
1 janv. 1990
1.996 mds
-2.417 mln.
-0.12%
1 janv. 1991
1.82 mds
-175.548 mln.
-8.8%
1 janv. 1992
1.868 mds
+47.724 mln.
2.62%
1 janv. 1993
1.896 mds
+28.204 mln.
1.51%
1 janv. 1994
1.956 mds
+59.649 mln.
3.15%
1 janv. 1995
1.911 mds
-45.324 mln.
-2.32%
1 janv. 1996
2.034 mds
+123.337 mln.
6.46%
1 janv. 1997
2.166 mds
+131.79 mln.
6.48%
1 janv. 1998
2.19 mds
+23.872 mln.
1.1%
1 janv. 1999
2.085 mds
-104.551 mln.
-4.77%
1 janv. 2000
2.078 mds
-7.096 mln.
-0.34%
1 janv. 2001
2.038 mds
-39.676 mln.
-1.91%
1 janv. 2002
2.123 mds
+84.991 mln.
4.17%
1 janv. 2003
2.135 mds
+11.243 mln.
0.53%
1 janv. 2004
2.258 mds
+123.578 mln.
5.79%
1 janv. 2005
2.365 mds
+106.482 mln.
4.72%
1 janv. 2006
2.453 mds
+88.232 mln.
3.73%
1 janv. 2007
2.693 mds
+240.506 mln.
9.81%
1 janv. 2008
2.754 mds
+61.043 mln.
2.27%
1 janv. 2009
2.846 mds
+91.873 mln.
3.34%
1 janv. 2010
2.74 mds
-106.012 mln.
-3.72%
1 janv. 2011
2.98 mds
+239.658 mln.
8.75%
1 janv. 2012
3.075 mds
+95.499 mln.
3.2%
1 janv. 2013
3.213 mds
+137.547 mln.
4.47%
1 janv. 2014
3.337 mds
+123.824 mln.
3.85%
1 janv. 2015
3.535 mds
+198.335 mln.
5.94%
Classement des pays selon les statistiques actuelles par années


Commentaires: