29
/fr/
fr
AIzaSyAYiBZKx7MnpbEhh9jyipgxe19OcubqV5w
April 1, 2024
154180
India
IND
true
2
1
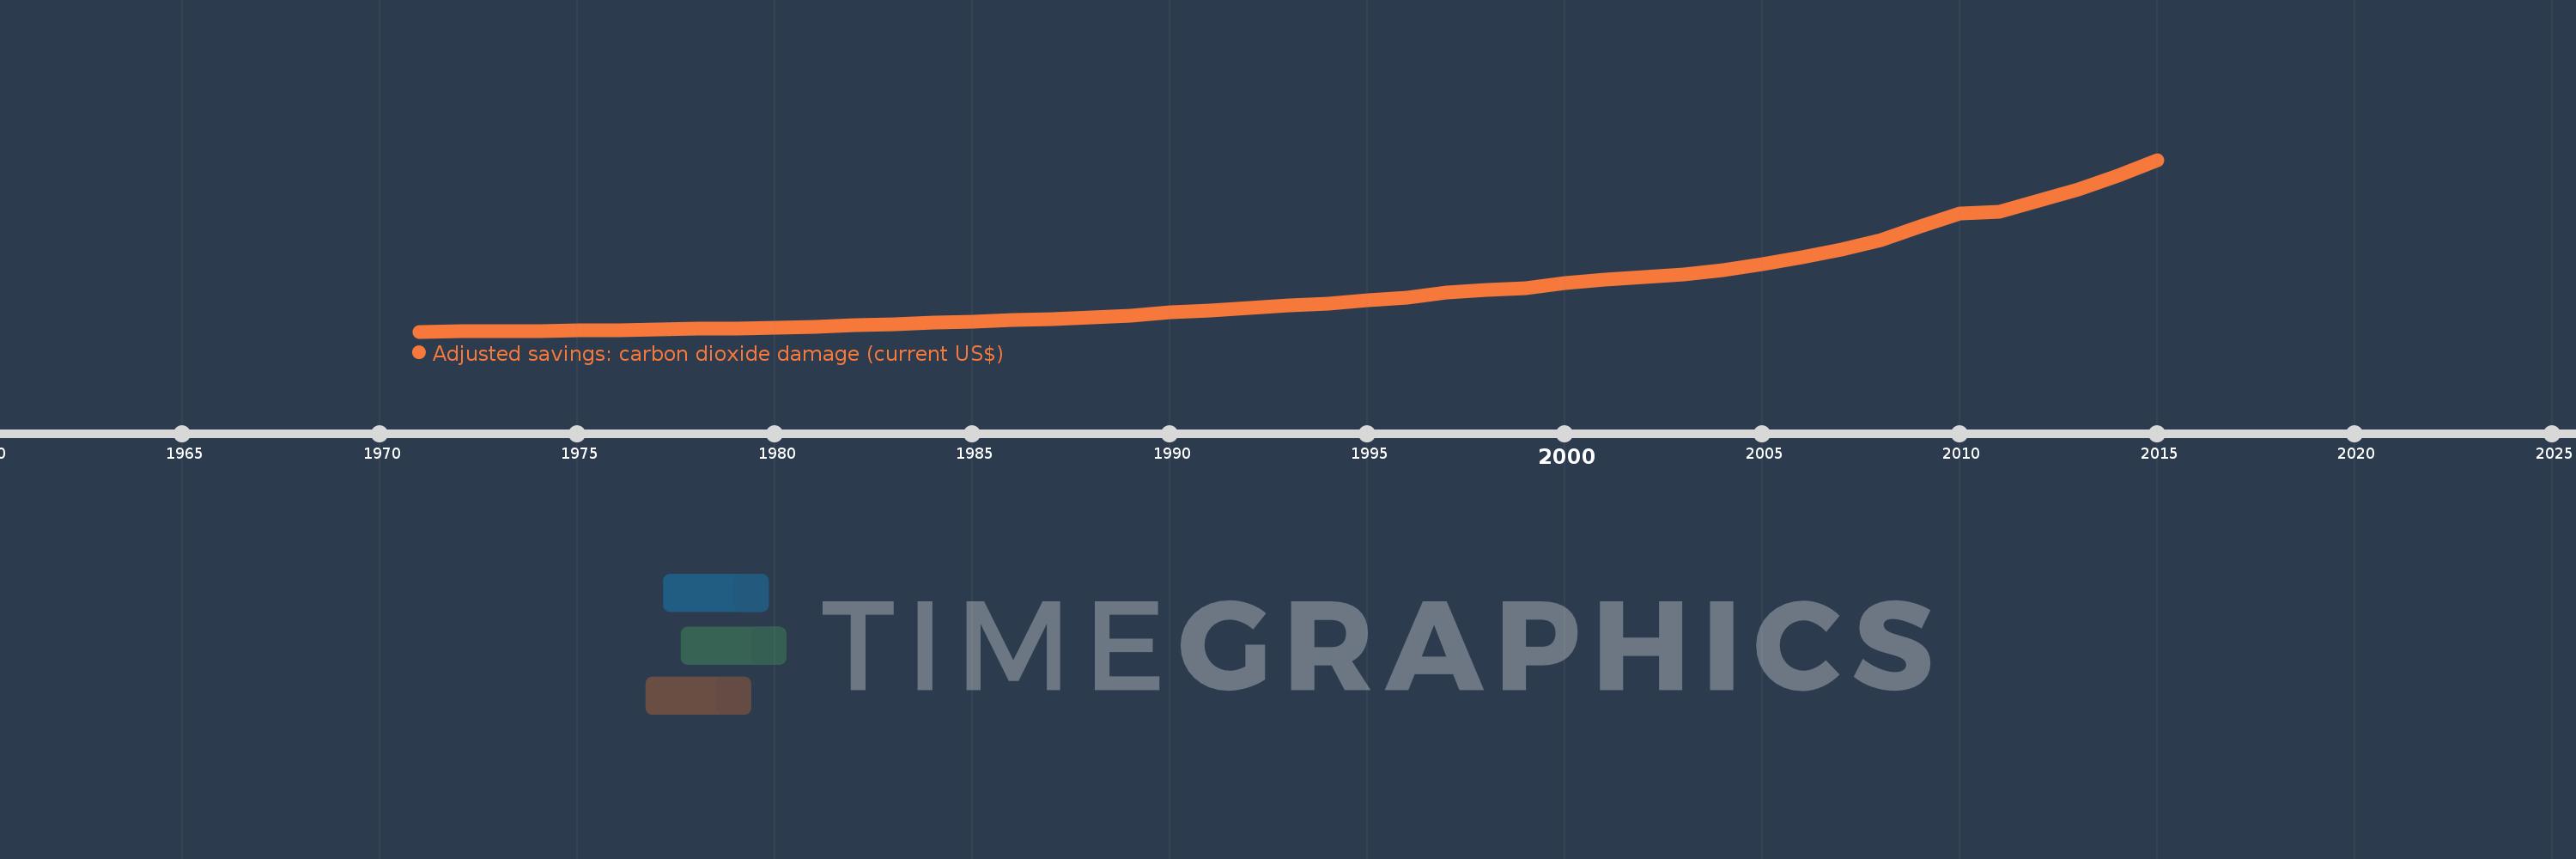
Adjusted savings: carbon dioxide damage (current US$)
2015,2014,2013,2012,2011,2010,2009,2008,2007,2006,2005,2004,2003,2002,2001,2000,1999,1998,1997,1996,1995,1994,1993,1992,1991,1990,1989,1988,1987,1986,1985,1984,1983,1982,1981,1980,1979,1978,1977,1976,1975,1974,1973,1972,1971
Cette statistique dans les autres pays:
AfghanistanAlbaniaAlgeriaAndorraAngolaAntigua and BarbudaArgentinaArmeniaArubaAustraliaAustriaAzerbaijanBahamas, TheBahrainBangladeshBarbadosBelarusBelgiumBelizeBeninBermudaBhutanBoliviaBosnia and HerzegovinaBotswanaBrazilBrunei DarussalamBulgariaBurkina FasoBurundiCabo VerdeCambodiaCameroonCanadaCayman IslandsCentral African RepublicChadChileChinaColombiaComorosCongo, Dem. Rep.Congo, Rep.Costa RicaCote d'IvoireCroatiaCubaCyprusCzech RepublicDenmarkDjiboutiDominicaDominican RepublicEcuadorEgypt, Arab Rep.El SalvadorEquatorial GuineaEritreaEstoniaEthiopiaFaroe IslandsFijiFinlandFranceFrench PolynesiaGabonGambia, TheGeorgiaGermanyGhanaGibraltarGreeceGreenlandGrenadaGuatemalaGuineaGuinea-BissauGuyanaHaitiHondurasHong Kong SAR, ChinaHungaryIcelandIndiaIndonesiaIran, Islamic Rep.IraqIrelandIsraelItalyJamaicaJapanJordanKazakhstanKenyaKiribatiKorea, Dem. People’s Rep.Korea, Rep.KuwaitKyrgyz RepublicLao PDRLatviaLebanonLesothoLiberiaLibyaLiechtensteinLithuaniaLuxembourgMacao SAR, ChinaMacedonia, FYRMadagascarMalawiMalaysiaMaldivesMaliMaltaMarshall IslandsMauritaniaMauritiusMexicoMicronesia, Fed. Sts.MoldovaMongoliaMontenegroMoroccoMozambiqueMyanmarNamibiaNepalNetherlandsNew CaledoniaNew ZealandNicaraguaNigerNigeriaNorwayOmanPakistanPalauPanamaPapua New GuineaParaguayPeruPhilippinesPolandPortugalQatarRomaniaRussian FederationRwandaSamoaSao Tome and PrincipeSaudi ArabiaSenegalSerbiaSeychellesSierra LeoneSingaporeSlovak RepublicSloveniaSolomon IslandsSomaliaSouth AfricaSpainSri LankaSt. Kitts and NevisSt. LuciaSt. Vincent and the GrenadinesSudanSurinameSwazilandSwedenSwitzerlandSyrian Arab RepublicTajikistanTanzaniaThailandTimor-LesteTogoTongaTrinidad and TobagoTunisiaTurkeyTurkmenistanTurks and Caicos IslandsUgandaUkraineUnited Arab EmiratesUnited KingdomUnited StatesUruguayUzbekistanVanuatuVenezuela, RBVietnamWest Bank and GazaYemen, Rep.ZambiaZimbabwe La ligne de temps
Cette échelle de temps montre un graphique de 1971 année à 2015 année India. Les données jusqu'à 1970 année ne sont pas présentés. Quantité d'observations actuelles selon dates: 45.
Source (désignation):
Les indicateurs du développement mondiale
Source (organisation):
World Bank staff estimates based on Samuel Fankhauser's "Valuing Climate Change: The Economics of the Greenhouse" (1995).
Catégories:
Economy & Growth, Environment
Dernière mise à jour
23 avr. 2017
Les indicateurs de changement de valeurs selon les années
Minimum:
260.475 mln.
1 janv. 1971
Maximum:
26.209 mds
1 janv. 2015
Pour la date d''observation
Valeur
Changement absolu
Le changement par rapport à la valeur précédente
1 janv. 1971
260.475 mln.
+260.475 mln.
0.0%
1 janv. 1972
292.139 mln.
+31.664 mln.
12.16%
1 janv. 1973
326.313 mln.
+34.174 mln.
11.7%
1 janv. 1974
358.492 mln.
+32.179 mln.
9.86%
1 janv. 1975
408.765 mln.
+50.273 mln.
14.02%
1 janv. 1976
491.231 mln.
+82.466 mln.
20.17%
1 janv. 1977
548.366 mln.
+57.135 mln.
11.63%
1 janv. 1978
705.143 mln.
+156.777 mln.
28.59%
1 janv. 1979
769.215 mln.
+64.072 mln.
9.09%
1 janv. 1980
879.341 mln.
+110.126 mln.
14.32%
1 janv. 1981
1.019 mds
+139.195 mln.
15.83%
1 janv. 1982
1.212 mds
+192.995 mln.
18.95%
1 janv. 1983
1.384 mds
+172.235 mln.
14.22%
1 janv. 1984
1.579 mds
+195.369 mln.
14.12%
1 janv. 1985
1.711 mds
+131.837 mln.
8.35%
1 janv. 1986
1.96 mds
+248.721 mln.
14.54%
1 janv. 1987
2.169 mds
+209.018 mln.
10.67%
1 janv. 1988
2.403 mds
+234.215 mln.
10.8%
1 janv. 1989
2.717 mds
+313.812 mln.
13.06%
1 janv. 1990
3.122 mds
+405.585 mln.
14.93%
1 janv. 1991
3.412 mds
+290.083 mln.
9.29%
1 janv. 1992
3.812 mds
+399.226 mln.
11.7%
1 janv. 1993
4.189 mds
+377.439 mln.
9.9%
1 janv. 1994
4.509 mds
+319.858 mln.
7.64%
1 janv. 1995
4.949 mds
+439.765 mln.
9.75%
1 janv. 1996
5.437 mds
+488.276 mln.
9.87%
1 janv. 1997
6.102 mds
+664.604 mln.
12.22%
1 janv. 1998
6.54 mds
+438.696 mln.
7.19%
1 janv. 1999
6.868 mds
+327.886 mln.
5.01%
1 janv. 2000
7.532 mds
+664.112 mln.
9.67%
1 janv. 2001
8.082 mds
+549.849 mln.
7.3%
1 janv. 2002
8.484 mds
+402.331 mln.
4.98%
1 janv. 2003
8.882 mds
+397.682 mln.
4.69%
1 janv. 2004
9.578 mds
+695.427 mln.
7.83%
1 janv. 2005
10.474 mds
+896.265 mln.
9.36%
1 janv. 2006
11.438 mds
+964.068 mln.
9.2%
1 janv. 2007
12.7 mds
+1.262 mds
11.04%
1 janv. 2008
14.111 mds
+1.411 mds
11.11%
1 janv. 2009
16.18 mds
+2.069 mds
14.66%
1 janv. 2010
18.062 mds
+1.881 mds
11.63%
1 janv. 2011
18.335 mds
+273.039 mln.
1.51%
1 janv. 2012
20.106 mds
+1.771 mds
9.66%
1 janv. 2013
21.734 mds
+1.627 mds
8.09%
1 janv. 2014
23.827 mds
+2.093 mds
9.63%
1 janv. 2015
26.209 mds
+2.382 mds
10.0%
Classement des pays selon les statistiques actuelles par années


Commentaires: