29
/fr/
fr
AIzaSyAYiBZKx7MnpbEhh9jyipgxe19OcubqV5w
April 1, 2024
222500
Peru
PER
true
2
1
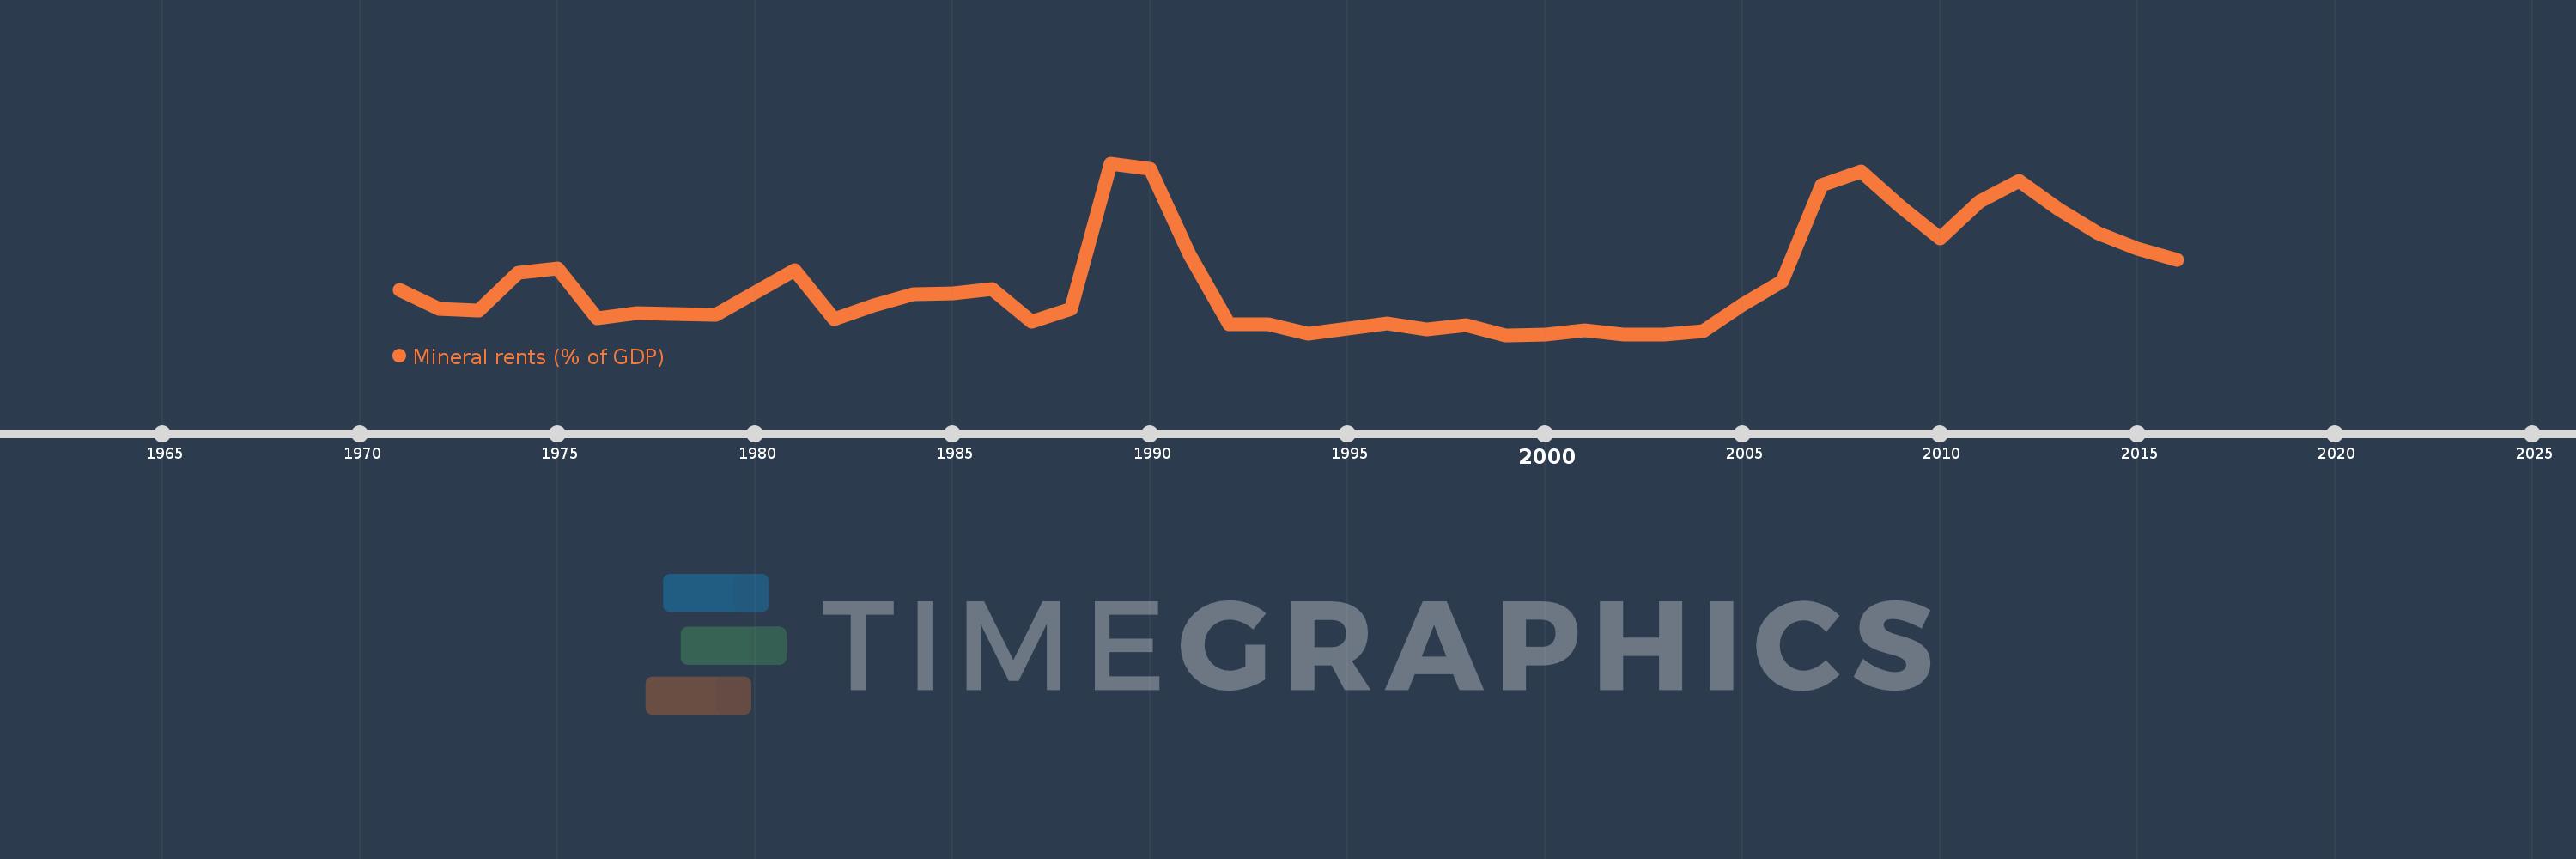
Mineral rents (% of GDP)
2016,2015,2014,2013,2012,2011,2010,2009,2008,2007,2006,2005,2004,2003,2002,2001,2000,1999,1998,1997,1996,1995,1994,1993,1992,1991,1990,1989,1988,1987,1986,1985,1984,1983,1982,1981,1980,1979,1978,1977,1976,1975,1974,1973,1972,1971
Cette statistique dans les autres pays:
AfghanistanAlbaniaAlgeriaAndorraAngolaAntigua and BarbudaArab WorldArgentinaArmeniaArubaAustraliaAustriaAzerbaijanBahamas, TheBahrainBangladeshBarbadosBelarusBelgiumBelizeBeninBermudaBhutanBoliviaBosnia and HerzegovinaBotswanaBrazilBrunei DarussalamBulgariaBurkina FasoBurundiCabo VerdeCambodiaCameroonCanadaCaribbean small statesCayman IslandsCentral African RepublicCentral Europe and the BalticsChadChannel IslandsChileChinaColombiaComorosCongo, Dem. Rep.Congo, Rep.Costa RicaCote d'IvoireCroatiaCubaCyprusCzech RepublicDenmarkDjiboutiDominicaDominican RepublicEarly-demographic dividendEast Asia & PacificEast Asia & Pacific (excluding high income)East Asia & Pacific (IDA & IBRD countries)EcuadorEgypt, Arab Rep.El SalvadorEquatorial GuineaEritreaEstoniaEthiopiaEuro areaEurope & Central AsiaEurope & Central Asia (excluding high income)Europe & Central Asia (IDA & IBRD countries)European UnionFaroe IslandsFijiFinlandFragile and conflict affected situationsFranceFrench PolynesiaGabonGambia, TheGeorgiaGermanyGhanaGreeceGreenlandGrenadaGuatemalaGuineaGuinea-BissauGuyanaHaitiHeavily indebted poor countries (HIPC)High incomeHondurasHong Kong SAR, ChinaHungaryIBRD onlyIcelandIDA & IBRD totalIDA blendIDA onlyIDA totalIndiaIndonesiaIran, Islamic Rep.IraqIrelandIsle of ManIsraelItalyJamaicaJapanJordanKazakhstanKenyaKiribatiKorea, Rep.KosovoKuwaitKyrgyz RepublicLao PDRLate-demographic dividendLatin America & Caribbean Latin America & Caribbean (excluding high income)Latin America & the Caribbean (IDA & IBRD countries)LatviaLeast developed countries: UN classificationLebanonLesothoLiberiaLibyaLiechtensteinLithuaniaLow & middle incomeLow incomeLower middle incomeLuxembourgMacao SAR, ChinaMacedonia, FYRMadagascarMalawiMalaysiaMaldivesMaliMaltaMarshall IslandsMauritaniaMauritiusMexicoMicronesia, Fed. Sts.Middle East & North AfricaMiddle East & North Africa (excluding high income)Middle East & North Africa (IDA & IBRD countries)Middle incomeMoldovaMonacoMongoliaMontenegroMoroccoMozambiqueMyanmarNamibiaNepalNetherlandsNew CaledoniaNew ZealandNicaraguaNigerNigeriaNorth AmericaNorwayOECD membersOmanOther small statesPacific island small statesPakistanPalauPanamaPapua New GuineaParaguayPeruPhilippinesPolandPortugalPost-demographic dividendPre-demographic dividendPuerto RicoQatarRomaniaRussian FederationRwandaSamoaSan MarinoSao Tome and PrincipeSaudi ArabiaSenegalSerbiaSeychellesSierra LeoneSingaporeSlovak RepublicSloveniaSmall statesSolomon IslandsSomaliaSouth AfricaSouth AsiaSouth Asia (IDA & IBRD)South SudanSpainSri LankaSt. Kitts and NevisSt. LuciaSt. Vincent and the GrenadinesSub-Saharan Africa Sub-Saharan Africa (excluding high income)Sub-Saharan Africa (IDA & IBRD countries)SudanSurinameSwazilandSwedenSwitzerlandSyrian Arab RepublicTajikistanTanzaniaThailandTimor-LesteTogoTongaTrinidad and TobagoTunisiaTurkeyTurkmenistanTuvaluUgandaUkraineUnited Arab EmiratesUnited KingdomUnited StatesUpper middle incomeUruguayUzbekistanVanuatuVenezuela, RBVietnamVirgin Islands (U.S.)West Bank and GazaWorldYemen, Rep.ZambiaZimbabwe La ligne de temps
Cette échelle de temps montre un graphique de 1971 année à 2016 année Peru. Les données jusqu'à 1970 année ne sont pas présentés. Quantité d'observations actuelles selon dates: 46.
Source (désignation):
Les indicateurs du développement mondiale
Source (organisation):
Estimates based on sources and methods described in "The Changing Wealth of Nations: Measuring Sustainable Development in the New Millennium" (World Bank, 2011).
Catégories:
Energy & Mining, Environment
Dernière mise à jour
23 avr. 2017
Les indicateurs de changement de valeurs selon les années
Minimum:
0.117
1 janv. 1999
Maximum:
12.264
1 janv. 1989
Pour la date d''observation
Valeur
Changement absolu
Le changement par rapport à la valeur précédente
1 janv. 1971
3.327
+3.327
0.0%
1 janv. 1972
1.955
-1.371
-41.22%
1 janv. 1973
1.844
-0.111
-5.7%
1 janv. 1974
4.51
+2.666
144.62%
1 janv. 1975
4.81
+0.3
6.65%
1 janv. 1976
1.301
-3.509
-72.95%
1 janv. 1977
1.644
+0.343
26.39%
1 janv. 1978
1.617
-0.027
-1.67%
1 janv. 1979
1.528
-0.089
-5.48%
1 janv. 1980
3.149
+1.621
106.04%
1 janv. 1981
4.708
+1.559
49.5%
1 janv. 1982
1.248
-3.461
-73.5%
1 janv. 1983
2.192
+0.945
75.71%
1 janv. 1984
2.976
+0.784
35.76%
1 janv. 1985
3.051
+0.074
2.5%
1 janv. 1986
3.355
+0.304
9.98%
1 janv. 1987
1.043
-2.311
-68.9%
1 janv. 1988
1.994
+0.951
91.11%
1 janv. 1989
12.264
+10.27
514.98%
1 janv. 1990
11.861
-0.403
-3.29%
1 janv. 1991
5.801
-6.06
-51.09%
1 janv. 1992
0.858
-4.943
-85.22%
1 janv. 1993
0.862
+0.004
0.49%
1 janv. 1994
0.186
-0.676
-78.44%
1 janv. 1995
0.575
+0.389
209.37%
1 janv. 1996
0.925
+0.35
60.88%
1 janv. 1997
0.495
-0.429
-46.44%
1 janv. 1998
0.802
+0.307
61.91%
1 janv. 1999
0.117
-0.684
-85.35%
1 janv. 2000
0.15
+0.033
28.07%
1 janv. 2001
0.434
+0.283
188.48%
1 janv. 2002
0.13
-0.304
-70.03%
1 janv. 2003
0.12
-0.01
-7.87%
1 janv. 2004
0.378
+0.259
216.02%
1 janv. 2005
2.277
+1.899
501.7%
1 janv. 2006
3.887
+1.609
70.67%
1 janv. 2007
10.734
+6.847
176.17%
1 janv. 2008
11.692
+0.958
8.93%
1 janv. 2009
9.171
-2.522
-21.57%
1 janv. 2010
6.963
-2.208
-24.08%
1 janv. 2011
9.549
+2.587
37.15%
1 janv. 2012
11.043
+1.494
15.64%
1 janv. 2013
9.044
-1.999
-18.1%
1 janv. 2014
7.318
-1.726
-19.08%
1 janv. 2015
6.227
-1.092
-14.92%
1 janv. 2016
5.434
-0.793
-12.73%
Classement des pays selon les statistiques actuelles par années


Commentaires: