29
/fr/
fr
AIzaSyAYiBZKx7MnpbEhh9jyipgxe19OcubqV5w
April 1, 2024
210678
Nicaragua
NIC
true
2
1
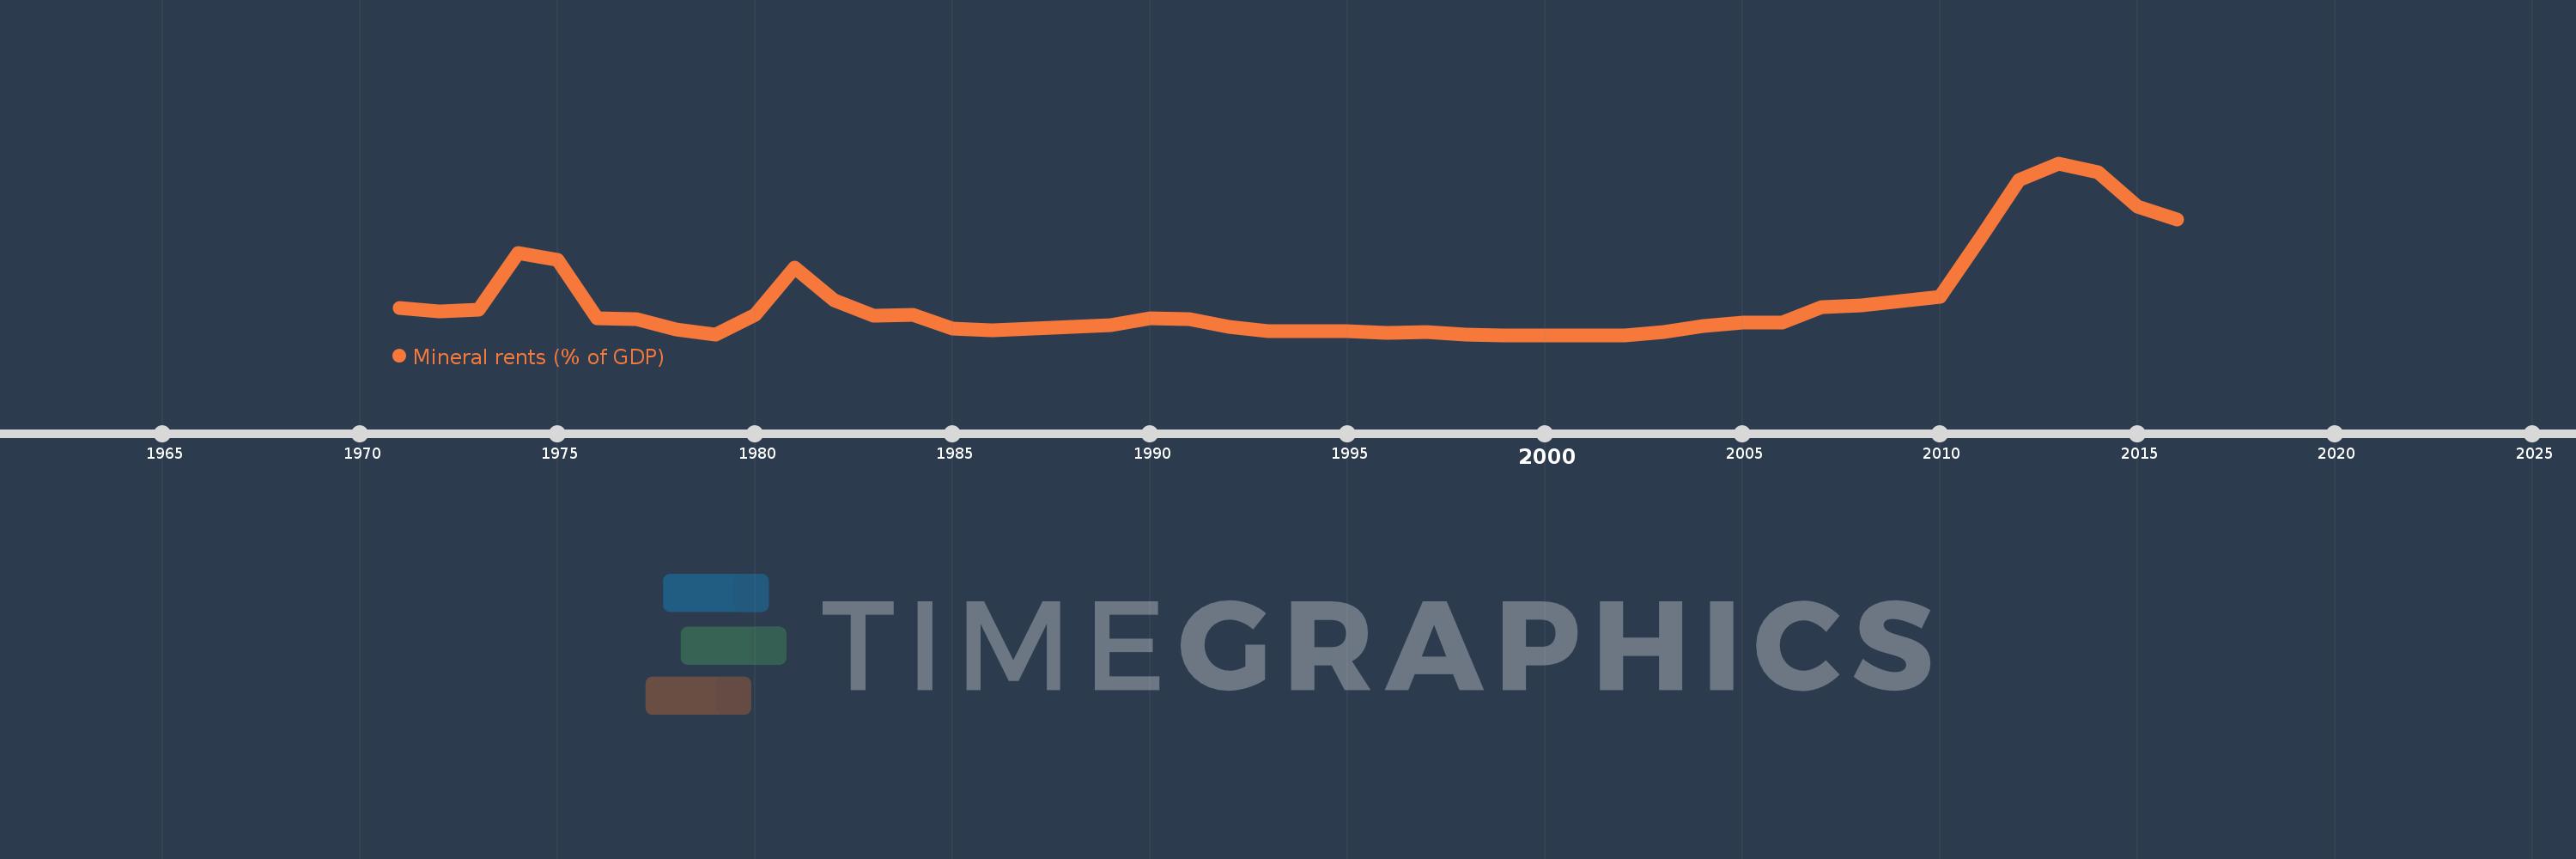
Mineral rents (% of GDP)
2016,2015,2014,2013,2012,2011,2010,2009,2008,2007,2006,2005,2004,2003,2002,2001,2000,1999,1998,1997,1996,1995,1994,1993,1992,1991,1990,1989,1988,1987,1986,1985,1984,1983,1982,1981,1980,1979,1978,1977,1976,1975,1974,1973,1972,1971
Cette statistique dans les autres pays:
AfghanistanAlbaniaAlgeriaAndorraAngolaAntigua and BarbudaArab WorldArgentinaArmeniaArubaAustraliaAustriaAzerbaijanBahamas, TheBahrainBangladeshBarbadosBelarusBelgiumBelizeBeninBermudaBhutanBoliviaBosnia and HerzegovinaBotswanaBrazilBrunei DarussalamBulgariaBurkina FasoBurundiCabo VerdeCambodiaCameroonCanadaCaribbean small statesCayman IslandsCentral African RepublicCentral Europe and the BalticsChadChannel IslandsChileChinaColombiaComorosCongo, Dem. Rep.Congo, Rep.Costa RicaCote d'IvoireCroatiaCubaCyprusCzech RepublicDenmarkDjiboutiDominicaDominican RepublicEarly-demographic dividendEast Asia & PacificEast Asia & Pacific (excluding high income)East Asia & Pacific (IDA & IBRD countries)EcuadorEgypt, Arab Rep.El SalvadorEquatorial GuineaEritreaEstoniaEthiopiaEuro areaEurope & Central AsiaEurope & Central Asia (excluding high income)Europe & Central Asia (IDA & IBRD countries)European UnionFaroe IslandsFijiFinlandFragile and conflict affected situationsFranceFrench PolynesiaGabonGambia, TheGeorgiaGermanyGhanaGreeceGreenlandGrenadaGuatemalaGuineaGuinea-BissauGuyanaHaitiHeavily indebted poor countries (HIPC)High incomeHondurasHong Kong SAR, ChinaHungaryIBRD onlyIcelandIDA & IBRD totalIDA blendIDA onlyIDA totalIndiaIndonesiaIran, Islamic Rep.IraqIrelandIsle of ManIsraelItalyJamaicaJapanJordanKazakhstanKenyaKiribatiKorea, Rep.KosovoKuwaitKyrgyz RepublicLao PDRLate-demographic dividendLatin America & Caribbean Latin America & Caribbean (excluding high income)Latin America & the Caribbean (IDA & IBRD countries)LatviaLeast developed countries: UN classificationLebanonLesothoLiberiaLibyaLiechtensteinLithuaniaLow & middle incomeLow incomeLower middle incomeLuxembourgMacao SAR, ChinaMacedonia, FYRMadagascarMalawiMalaysiaMaldivesMaliMaltaMarshall IslandsMauritaniaMauritiusMexicoMicronesia, Fed. Sts.Middle East & North AfricaMiddle East & North Africa (excluding high income)Middle East & North Africa (IDA & IBRD countries)Middle incomeMoldovaMonacoMongoliaMontenegroMoroccoMozambiqueMyanmarNamibiaNepalNetherlandsNew CaledoniaNew ZealandNicaraguaNigerNigeriaNorth AmericaNorwayOECD membersOmanOther small statesPacific island small statesPakistanPalauPanamaPapua New GuineaParaguayPeruPhilippinesPolandPortugalPost-demographic dividendPre-demographic dividendPuerto RicoQatarRomaniaRussian FederationRwandaSamoaSan MarinoSao Tome and PrincipeSaudi ArabiaSenegalSerbiaSeychellesSierra LeoneSingaporeSlovak RepublicSloveniaSmall statesSolomon IslandsSomaliaSouth AfricaSouth AsiaSouth Asia (IDA & IBRD)South SudanSpainSri LankaSt. Kitts and NevisSt. LuciaSt. Vincent and the GrenadinesSub-Saharan Africa Sub-Saharan Africa (excluding high income)Sub-Saharan Africa (IDA & IBRD countries)SudanSurinameSwazilandSwedenSwitzerlandSyrian Arab RepublicTajikistanTanzaniaThailandTimor-LesteTogoTongaTrinidad and TobagoTunisiaTurkeyTurkmenistanTuvaluUgandaUkraineUnited Arab EmiratesUnited KingdomUnited StatesUpper middle incomeUruguayUzbekistanVanuatuVenezuela, RBVietnamVirgin Islands (U.S.)West Bank and GazaWorldYemen, Rep.ZambiaZimbabwe La ligne de temps
Cette échelle de temps montre un graphique de 1971 année à 2016 année Nicaragua. Les données jusqu'à 1970 année ne sont pas présentés. Quantité d'observations actuelles selon dates: 46.
Source (désignation):
Les indicateurs du développement mondiale
Source (organisation):
Estimates based on sources and methods described in "The Changing Wealth of Nations: Measuring Sustainable Development in the New Millennium" (World Bank, 2011).
Catégories:
Energy & Mining, Environment
Dernière mise à jour
23 avr. 2017
Les indicateurs de changement de valeurs selon les années
Maximum:
2.771
1 janv. 2013
Pour la date d''observation
Valeur
Changement absolu
Le changement par rapport à la valeur précédente
1 janv. 1971
0.436
+0.436
0.0%
1 janv. 1972
0.375
-0.061
-14.08%
1 janv. 1973
0.411
+0.036
9.74%
1 janv. 1974
1.326
+0.915
222.64%
1 janv. 1975
1.21
-0.116
-8.73%
1 janv. 1976
0.264
-0.946
-78.17%
1 janv. 1977
0.254
-0.01
-3.93%
1 janv. 1978
0.096
-0.158
-62.3%
1 janv. 1979
0.013
-0.083
-86.43%
1 janv. 1980
0.321
+0.308
2.37 milles%
1 janv. 1981
1.085
+0.764
238.32%
1 janv. 1982
0.56
-0.525
-48.36%
1 janv. 1983
0.305
-0.255
-45.53%
1 janv. 1984
0.33
+0.025
8.12%
1 janv. 1985
0.109
-0.221
-67.05%
1 janv. 1986
0.083
-0.026
-23.79%
1 janv. 1987
0.106
+0.023
27.35%
1 janv. 1988
0.127
+0.021
19.93%
1 janv. 1989
0.161
+0.035
27.36%
1 janv. 1990
0.273
+0.111
69.11%
1 janv. 1991
0.262
-0.011
-3.89%
1 janv. 1992
0.13
-0.132
-50.4%
1 janv. 1993
0.06
-0.07
-53.6%
1 janv. 1994
0.068
+0.008
12.69%
1 janv. 1995
0.06
-0.008
-12.35%
1 janv. 1996
0.035
-0.025
-41.68%
1 janv. 1997
0.049
+0.015
42.45%
1 janv. 1998
0.007
-0.042
-85.67%
1 janv. 1999
0.0
-0.007
-100.0%
1 janv. 2003
0.052
+0.052
%
1 janv. 2004
0.142
+0.09
172.5%
1 janv. 2005
0.204
+0.062
43.97%
1 janv. 2006
0.207
+0.003
1.37%
1 janv. 2007
0.449
+0.243
117.21%
1 janv. 2008
0.48
+0.03
6.74%
1 janv. 2009
0.545
+0.065
13.54%
1 janv. 2010
0.61
+0.066
12.06%
1 janv. 2011
1.547
+0.937
153.44%
1 janv. 2012
2.497
+0.95
61.41%
1 janv. 2013
2.771
+0.275
10.99%
1 janv. 2014
2.62
-0.152
-5.47%
1 janv. 2015
2.068
-0.552
-21.05%
1 janv. 2016
1.87
-0.198
-9.58%
Classement des pays selon les statistiques actuelles par années


Commentaires: