29
/fr/
fr
AIzaSyAYiBZKx7MnpbEhh9jyipgxe19OcubqV5w
April 1, 2024
210647
Nicaragua
NIC
true
2
1
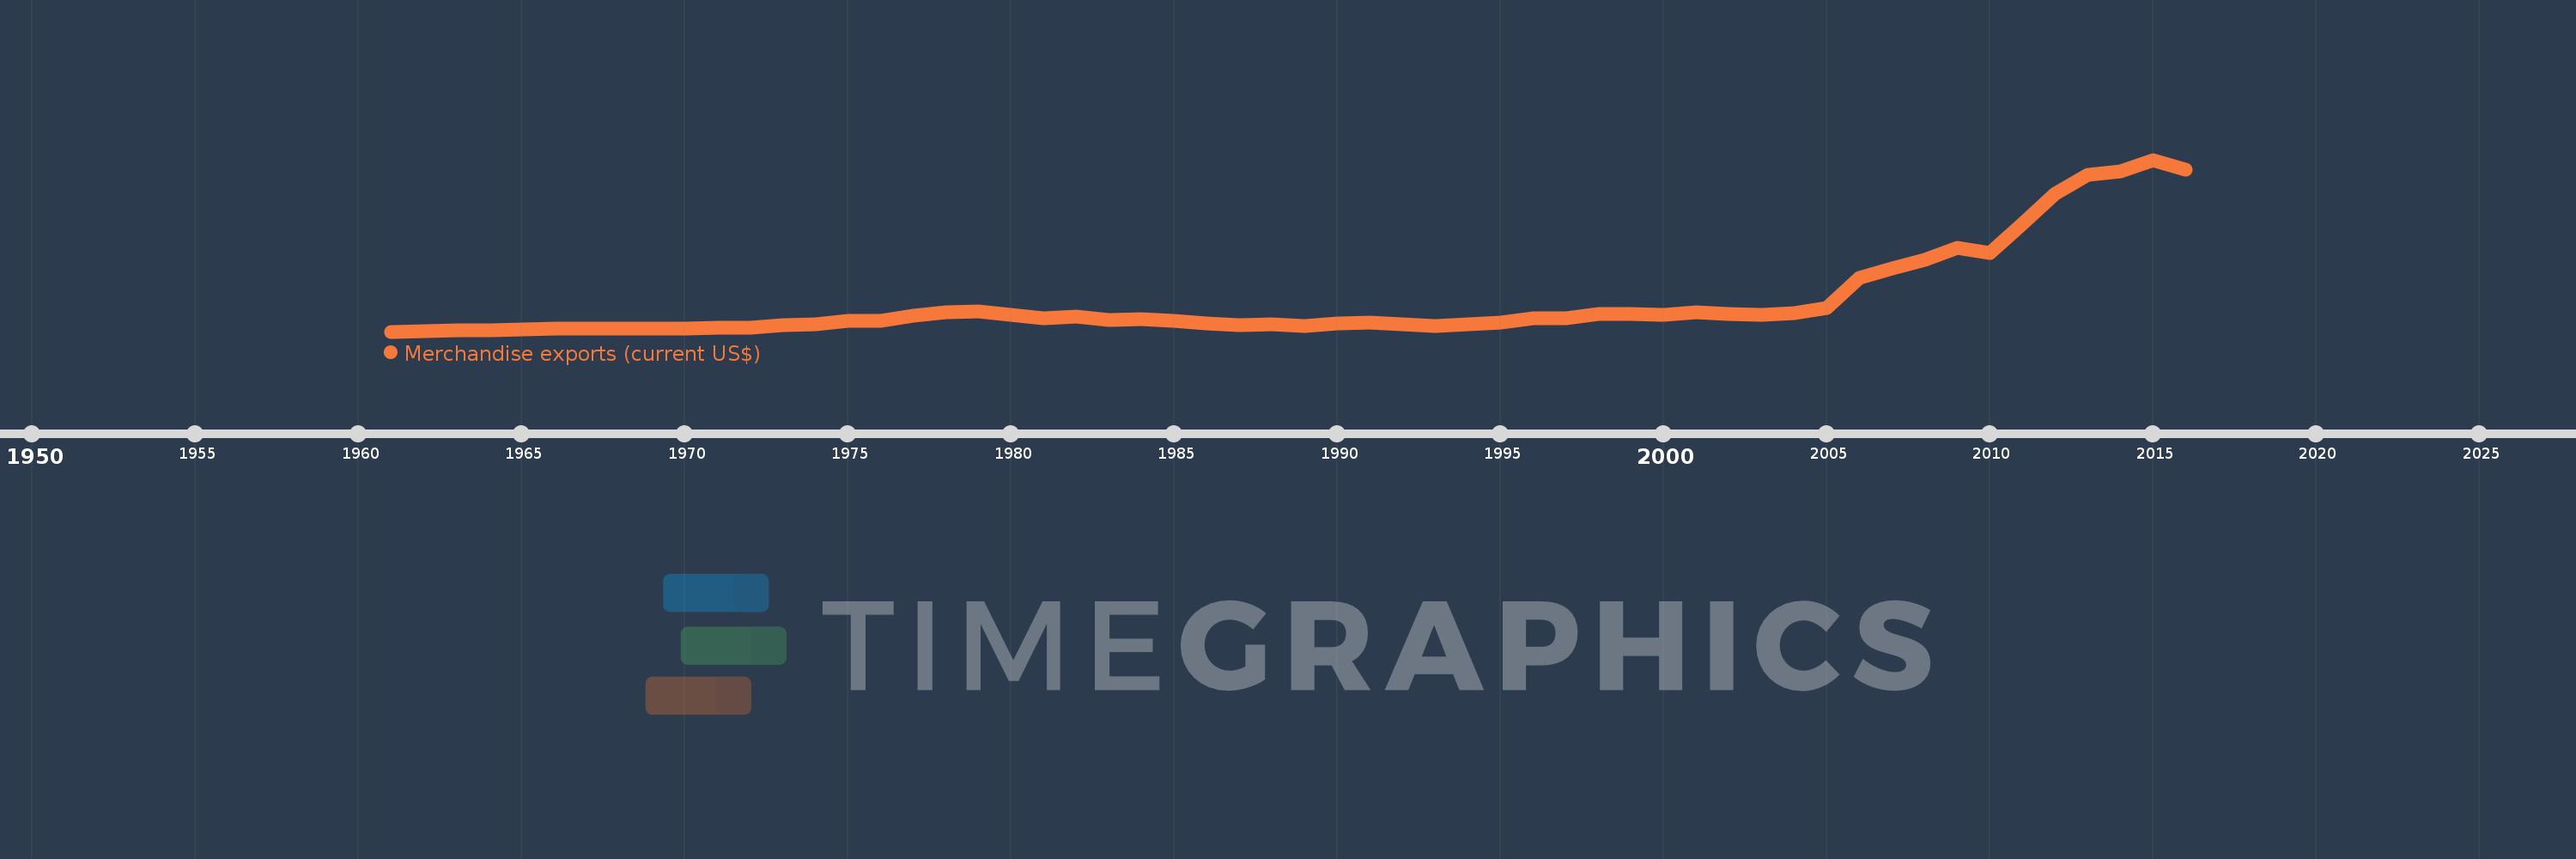
Merchandise exports (current US$)
2016,2015,2014,2013,2012,2011,2010,2009,2008,2007,2006,2005,2004,2003,2002,2001,2000,1999,1998,1997,1996,1995,1994,1993,1992,1991,1990,1989,1988,1987,1986,1985,1984,1983,1982,1981,1980,1979,1978,1977,1976,1975,1974,1973,1972,1971,1970,1969,1968,1967,1966,1965,1964,1963,1962,1961
Cette statistique dans les autres pays:
AfghanistanAlbaniaAlgeriaAmerican SamoaAngolaAntigua and BarbudaArab WorldArgentinaArmeniaArubaAustraliaAustriaAzerbaijanBahamas, TheBahrainBangladeshBarbadosBelarusBelgiumBelizeBeninBermudaBhutanBoliviaBosnia and HerzegovinaBotswanaBrazilBrunei DarussalamBulgariaBurkina FasoBurundiCabo VerdeCambodiaCameroonCanadaCaribbean small statesCentral African RepublicCentral Europe and the BalticsChadChileChinaColombiaComorosCongo, Dem. Rep.Congo, Rep.Costa RicaCote d'IvoireCroatiaCubaCuracaoCyprusCzech RepublicDenmarkDjiboutiDominicaDominican RepublicEarly-demographic dividendEast Asia & PacificEast Asia & Pacific (excluding high income)East Asia & Pacific (IDA & IBRD countries)EcuadorEgypt, Arab Rep.El SalvadorEquatorial GuineaEritreaEstoniaEthiopiaEuro areaEurope & Central AsiaEurope & Central Asia (excluding high income)Europe & Central Asia (IDA & IBRD countries)European UnionFaroe IslandsFijiFinlandFragile and conflict affected situationsFranceFrench PolynesiaGabonGambia, TheGeorgiaGermanyGhanaGreeceGreenlandGrenadaGuamGuatemalaGuineaGuinea-BissauGuyanaHaitiHeavily indebted poor countries (HIPC)High incomeHondurasHong Kong SAR, ChinaHungaryIBRD onlyIcelandIDA & IBRD totalIDA blendIDA onlyIDA totalIndiaIndonesiaIran, Islamic Rep.IraqIrelandIsraelItalyJamaicaJapanJordanKazakhstanKenyaKiribatiKorea, Dem. People’s Rep.Korea, Rep.KuwaitKyrgyz RepublicLao PDRLate-demographic dividendLatin America & Caribbean Latin America & Caribbean (excluding high income)Latin America & the Caribbean (IDA & IBRD countries)LatviaLeast developed countries: UN classificationLebanonLesothoLiberiaLibyaLithuaniaLow & middle incomeLow incomeLower middle incomeLuxembourgMacao SAR, ChinaMacedonia, FYRMadagascarMalawiMalaysiaMaldivesMaliMaltaMarshall IslandsMauritaniaMauritiusMexicoMicronesia, Fed. Sts.Middle East & North AfricaMiddle East & North Africa (excluding high income)Middle East & North Africa (IDA & IBRD countries)Middle incomeMoldovaMongoliaMontenegroMoroccoMozambiqueMyanmarNamibiaNepalNetherlandsNew CaledoniaNew ZealandNicaraguaNigerNigeriaNorth AmericaNorthern Mariana IslandsNorwayOECD membersOmanOther small statesPacific island small statesPakistanPalauPanamaPapua New GuineaParaguayPeruPhilippinesPolandPortugalPost-demographic dividendPre-demographic dividendQatarRomaniaRussian FederationRwandaSamoaSao Tome and PrincipeSaudi ArabiaSenegalSerbiaSeychellesSierra LeoneSingaporeSint Maarten (Dutch part)Slovak RepublicSloveniaSmall statesSolomon IslandsSouth AfricaSouth AsiaSouth Asia (IDA & IBRD)SpainSri LankaSt. Kitts and NevisSt. LuciaSt. Martin (French part)St. Vincent and the GrenadinesSub-Saharan Africa Sub-Saharan Africa (excluding high income)Sub-Saharan Africa (IDA & IBRD countries)SudanSurinameSwazilandSwedenSwitzerlandSyrian Arab RepublicTajikistanTanzaniaThailandTimor-LesteTogoTongaTrinidad and TobagoTunisiaTurkeyTurkmenistanTuvaluUgandaUkraineUnited Arab EmiratesUnited KingdomUnited StatesUpper middle incomeUruguayUzbekistanVanuatuVenezuela, RBVietnamWorldYemen, Rep.ZambiaZimbabwe La ligne de temps
Cette échelle de temps montre un graphique de 1961 année à 2016 année Nicaragua. Les données jusqu'à 1960 année ne sont pas présentés. Quantité d'observations actuelles selon dates: 56.
Source (désignation):
Les indicateurs du développement mondiale
Source (organisation):
World Trade Organization.
Catégories:
Private Sector, Trade
Dernière mise à jour
23 avr. 2017
Les indicateurs de changement de valeurs selon les années
Minimum:
62.87 mln.
1 janv. 1961
Maximum:
5.126 mds
1 janv. 2015
Pour la date d''observation
Valeur
Changement absolu
Le changement par rapport à la valeur précédente
1 janv. 1961
62.87 mln.
+62.87 mln.
0.0%
1 janv. 1962
68.36 mln.
+5.49 mln.
8.73%
1 janv. 1963
90.17 mln.
+21.81 mln.
31.9%
1 janv. 1964
106.77 mln.
+16.6 mln.
18.41%
1 janv. 1965
125.18 mln.
+18.41 mln.
17.24%
1 janv. 1966
148.94 mln.
+23.76 mln.
18.98%
1 janv. 1967
142.21 mln.
-6.73 mln.
-4.52%
1 janv. 1968
151.68 mln.
+9.47 mln.
6.66%
1 janv. 1969
162.3 mln.
+10.62 mln.
7.0%
1 janv. 1970
158.75 mln.
-3.55 mln.
-2.19%
1 janv. 1971
178.62 mln.
+19.87 mln.
12.52%
1 janv. 1972
187.24 mln.
+8.62 mln.
4.83%
1 janv. 1973
249.44 mln.
+62.2 mln.
33.22%
1 janv. 1974
277.89 mln.
+28.45 mln.
11.41%
1 janv. 1975
380.92 mln.
+103.03 mln.
37.08%
1 janv. 1976
375.17 mln.
-5.75 mln.
-1.51%
1 janv. 1977
541.9 mln.
+166.73 mln.
44.44%
1 janv. 1978
636.8 mln.
+94.9 mln.
17.51%
1 janv. 1979
645.97 mln.
+9.17 mln.
1.44%
1 janv. 1980
566.56 mln.
-79.41 mln.
-12.29%
1 janv. 1981
451.0 mln.
-115.56 mln.
-20.4%
1 janv. 1982
508.0 mln.
+57.0 mln.
12.64%
1 janv. 1983
406.0 mln.
-102.0 mln.
-20.08%
1 janv. 1984
429.0 mln.
+23.0 mln.
5.67%
1 janv. 1985
386.0 mln.
-43.0 mln.
-10.02%
1 janv. 1986
302.0 mln.
-84.0 mln.
-21.76%
1 janv. 1987
247.0 mln.
-55.0 mln.
-18.21%
1 janv. 1988
273.0 mln.
+26.0 mln.
10.53%
1 janv. 1989
233.0 mln.
-40.0 mln.
-14.65%
1 janv. 1990
311.0 mln.
+78.0 mln.
33.48%
1 janv. 1991
330.0 mln.
+19.0 mln.
6.11%
1 janv. 1992
272.0 mln.
-58.0 mln.
-17.58%
1 janv. 1993
223.0 mln.
-49.0 mln.
-18.01%
1 janv. 1994
267.0 mln.
+44.0 mln.
19.73%
1 janv. 1995
334.7 mln.
+67.7 mln.
25.36%
1 janv. 1996
466.0 mln.
+131.3 mln.
39.23%
1 janv. 1997
466.0 mln.
0.0
0.0%
1 janv. 1998
577.0 mln.
+111.0 mln.
23.82%
1 janv. 1999
573.0 mln.
-4.0 mln.
-0.69%
1 janv. 2000
545.0 mln.
-28.0 mln.
-4.89%
1 janv. 2001
645.0 mln.
+100.0 mln.
18.35%
1 janv. 2002
589.0 mln.
-56.0 mln.
-8.68%
1 janv. 2003
561.0 mln.
-28.0 mln.
-4.75%
1 janv. 2004
604.548 mln.
+43.548 mln.
7.76%
1 janv. 2005
755.56 mln.
+151.012 mln.
24.98%
1 janv. 2006
1.654 mds
+898.57 mln.
118.93%
1 janv. 2007
1.932 mds
+277.97 mln.
16.8%
1 janv. 2008
2.186 mds
+254.1 mln.
13.15%
1 janv. 2009
2.531 mds
+345.1 mln.
15.79%
1 janv. 2010
2.391 mds
-140.7 mln.
-5.56%
1 janv. 2011
3.251 mds
+860.3 mln.
35.99%
1 janv. 2012
4.133 mds
+881.6 mln.
27.12%
1 janv. 2013
4.686 mds
+553.6 mln.
13.4%
1 janv. 2014
4.794 mds
+107.5 mln.
2.29%
1 janv. 2015
5.126 mds
+332.08 mln.
6.93%
1 janv. 2016
4.839 mds
-286.33 mln.
-5.59%
Classement des pays selon les statistiques actuelles par années


Commentaires: