29
/fr/
fr
AIzaSyAYiBZKx7MnpbEhh9jyipgxe19OcubqV5w
April 1, 2024
117138
Cyprus
CYP
true
2
1
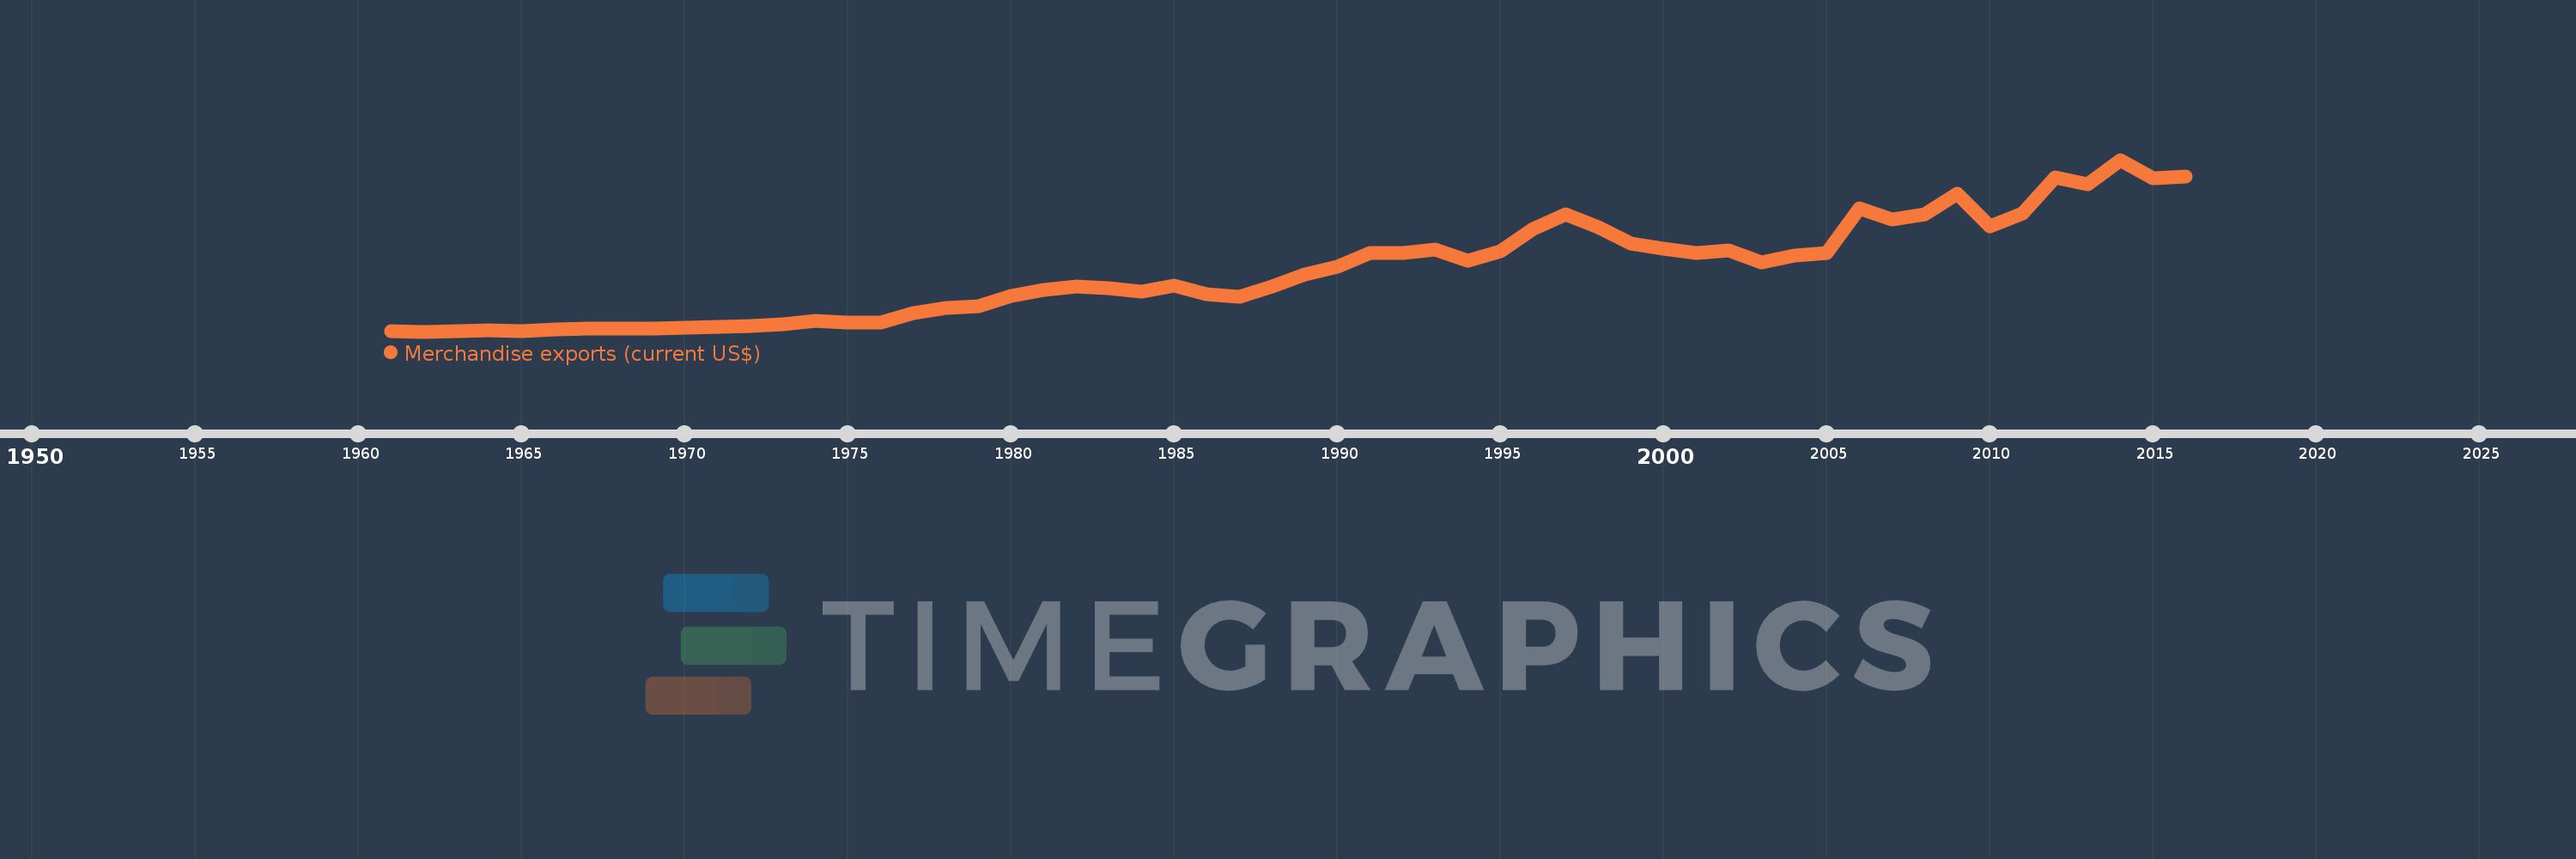
Merchandise exports (current US$)
2016,2015,2014,2013,2012,2011,2010,2009,2008,2007,2006,2005,2004,2003,2002,2001,2000,1999,1998,1997,1996,1995,1994,1993,1992,1991,1990,1989,1988,1987,1986,1985,1984,1983,1982,1981,1980,1979,1978,1977,1976,1975,1974,1973,1972,1971,1970,1969,1968,1967,1966,1965,1964,1963,1962,1961
Cette statistique dans les autres pays:
AfghanistanAlbaniaAlgeriaAmerican SamoaAngolaAntigua and BarbudaArab WorldArgentinaArmeniaArubaAustraliaAustriaAzerbaijanBahamas, TheBahrainBangladeshBarbadosBelarusBelgiumBelizeBeninBermudaBhutanBoliviaBosnia and HerzegovinaBotswanaBrazilBrunei DarussalamBulgariaBurkina FasoBurundiCabo VerdeCambodiaCameroonCanadaCaribbean small statesCentral African RepublicCentral Europe and the BalticsChadChileChinaColombiaComorosCongo, Dem. Rep.Congo, Rep.Costa RicaCote d'IvoireCroatiaCubaCuracaoCyprusCzech RepublicDenmarkDjiboutiDominicaDominican RepublicEarly-demographic dividendEast Asia & PacificEast Asia & Pacific (excluding high income)East Asia & Pacific (IDA & IBRD countries)EcuadorEgypt, Arab Rep.El SalvadorEquatorial GuineaEritreaEstoniaEthiopiaEuro areaEurope & Central AsiaEurope & Central Asia (excluding high income)Europe & Central Asia (IDA & IBRD countries)European UnionFaroe IslandsFijiFinlandFragile and conflict affected situationsFranceFrench PolynesiaGabonGambia, TheGeorgiaGermanyGhanaGreeceGreenlandGrenadaGuamGuatemalaGuineaGuinea-BissauGuyanaHaitiHeavily indebted poor countries (HIPC)High incomeHondurasHong Kong SAR, ChinaHungaryIBRD onlyIcelandIDA & IBRD totalIDA blendIDA onlyIDA totalIndiaIndonesiaIran, Islamic Rep.IraqIrelandIsraelItalyJamaicaJapanJordanKazakhstanKenyaKiribatiKorea, Dem. People’s Rep.Korea, Rep.KuwaitKyrgyz RepublicLao PDRLate-demographic dividendLatin America & Caribbean Latin America & Caribbean (excluding high income)Latin America & the Caribbean (IDA & IBRD countries)LatviaLeast developed countries: UN classificationLebanonLesothoLiberiaLibyaLithuaniaLow & middle incomeLow incomeLower middle incomeLuxembourgMacao SAR, ChinaMacedonia, FYRMadagascarMalawiMalaysiaMaldivesMaliMaltaMarshall IslandsMauritaniaMauritiusMexicoMicronesia, Fed. Sts.Middle East & North AfricaMiddle East & North Africa (excluding high income)Middle East & North Africa (IDA & IBRD countries)Middle incomeMoldovaMongoliaMontenegroMoroccoMozambiqueMyanmarNamibiaNepalNetherlandsNew CaledoniaNew ZealandNicaraguaNigerNigeriaNorth AmericaNorthern Mariana IslandsNorwayOECD membersOmanOther small statesPacific island small statesPakistanPalauPanamaPapua New GuineaParaguayPeruPhilippinesPolandPortugalPost-demographic dividendPre-demographic dividendQatarRomaniaRussian FederationRwandaSamoaSao Tome and PrincipeSaudi ArabiaSenegalSerbiaSeychellesSierra LeoneSingaporeSint Maarten (Dutch part)Slovak RepublicSloveniaSmall statesSolomon IslandsSouth AfricaSouth AsiaSouth Asia (IDA & IBRD)SpainSri LankaSt. Kitts and NevisSt. LuciaSt. Martin (French part)St. Vincent and the GrenadinesSub-Saharan Africa Sub-Saharan Africa (excluding high income)Sub-Saharan Africa (IDA & IBRD countries)SudanSurinameSwazilandSwedenSwitzerlandSyrian Arab RepublicTajikistanTanzaniaThailandTimor-LesteTogoTongaTrinidad and TobagoTunisiaTurkeyTurkmenistanTuvaluUgandaUkraineUnited Arab EmiratesUnited KingdomUnited StatesUpper middle incomeUruguayUzbekistanVanuatuVenezuela, RBVietnamWorldYemen, Rep.ZambiaZimbabwe La ligne de temps
Cette échelle de temps montre un graphique de 1961 année à 2016 année Cyprus. Les données jusqu'à 1960 année ne sont pas présentés. Quantité d'observations actuelles selon dates: 56.
Source (désignation):
Les indicateurs du développement mondiale
Source (organisation):
World Trade Organization.
Catégories:
Private Sector, Trade
Dernière mise à jour
23 avr. 2017
Les indicateurs de changement de valeurs selon les années
Minimum:
49.784 mln.
1 janv. 1962
Maximum:
2.019 mds
1 janv. 2014
Pour la date d''observation
Valeur
Changement absolu
Le changement par rapport à la valeur précédente
1 janv. 1961
53.85 mln.
+53.85 mln.
0.0%
1 janv. 1962
49.784 mln.
-4.066 mln.
-7.55%
1 janv. 1963
58.232 mln.
+8.448 mln.
16.97%
1 janv. 1964
61.326 mln.
+3.094 mln.
5.31%
1 janv. 1965
57.537 mln.
-3.788 mln.
-6.18%
1 janv. 1966
70.806 mln.
+13.269 mln.
23.06%
1 janv. 1967
81.866 mln.
+11.06 mln.
15.62%
1 janv. 1968
82.011 mln.
+144.8 milles
0.18%
1 janv. 1969
88.701 mln.
+6.69 mln.
8.16%
1 janv. 1970
98.167 mln.
+9.466 mln.
10.67%
1 janv. 1971
108.454 mln.
+10.287 mln.
10.48%
1 janv. 1972
114.888 mln.
+6.434 mln.
5.93%
1 janv. 1973
133.742 mln.
+18.854 mln.
16.41%
1 janv. 1974
172.946 mln.
+39.204 mln.
29.31%
1 janv. 1975
152.202 mln.
-20.744 mln.
-11.99%
1 janv. 1976
151.838 mln.
-364.0 milles
-0.24%
1 janv. 1977
257.856 mln.
+106.018 mln.
69.82%
1 janv. 1978
317.664 mln.
+59.808 mln.
23.19%
1 janv. 1979
343.772 mln.
+26.108 mln.
8.22%
1 janv. 1980
456.392 mln.
+112.62 mln.
32.76%
1 janv. 1981
532.0 mln.
+75.608 mln.
16.57%
1 janv. 1982
562.0 mln.
+30.0 mln.
5.64%
1 janv. 1983
544.0 mln.
-18.0 mln.
-3.2%
1 janv. 1984
503.0 mln.
-41.0 mln.
-7.54%
1 janv. 1985
573.0 mln.
+70.0 mln.
13.92%
1 janv. 1986
476.0 mln.
-97.0 mln.
-16.93%
1 janv. 1987
451.0 mln.
-25.0 mln.
-5.25%
1 janv. 1988
568.0 mln.
+117.0 mln.
25.94%
1 janv. 1989
705.0 mln.
+137.0 mln.
24.12%
1 janv. 1990
791.0 mln.
+86.0 mln.
12.2%
1 janv. 1991
951.0 mln.
+160.0 mln.
20.23%
1 janv. 1992
952.0 mln.
+1000.0 milles
0.11%
1 janv. 1993
987.0 mln.
+35.0 mln.
3.68%
1 janv. 1994
867.0 mln.
-120.0 mln.
-12.16%
1 janv. 1995
968.0 mln.
+101.0 mln.
11.65%
1 janv. 1996
1.229 mds
+261.0 mln.
26.96%
1 janv. 1997
1.391 mds
+162.0 mln.
13.18%
1 janv. 1998
1.25 mds
-141.0 mln.
-10.14%
1 janv. 1999
1.061 mds
-189.0 mln.
-15.12%
1 janv. 2000
997.0 mln.
-64.0 mln.
-6.03%
1 janv. 2001
951.0 mln.
-46.0 mln.
-4.61%
1 janv. 2002
976.0 mln.
+25.0 mln.
2.63%
1 janv. 2003
843.0 mln.
-133.0 mln.
-13.63%
1 janv. 2004
923.0 mln.
+80.0 mln.
9.49%
1 janv. 2005
947.584 mln.
+24.584 mln.
2.66%
1 janv. 2006
1.465 mds
+517.254 mln.
54.59%
1 janv. 2007
1.333 mds
-131.7 mln.
-8.99%
1 janv. 2008
1.394 mds
+60.865 mln.
4.57%
1 janv. 2009
1.633 mds
+239.06 mln.
17.15%
1 janv. 2010
1.257 mds
-375.718 mln.
-23.01%
1 janv. 2011
1.402 mds
+144.815 mln.
11.52%
1 janv. 2012
1.818 mds
+415.841 mln.
29.66%
1 janv. 2013
1.74 mds
-78.382 mln.
-4.31%
1 janv. 2014
2.019 mds
+279.624 mln.
16.07%
1 janv. 2015
1.811 mds
-207.833 mln.
-10.29%
1 janv. 2016
1.829 mds
+17.934 mln.
0.99%
Classement des pays selon les statistiques actuelles par années


Commentaires: