29
/fr/
fr
AIzaSyAYiBZKx7MnpbEhh9jyipgxe19OcubqV5w
April 1, 2024
209571
New Zealand
NZL
true
2
1
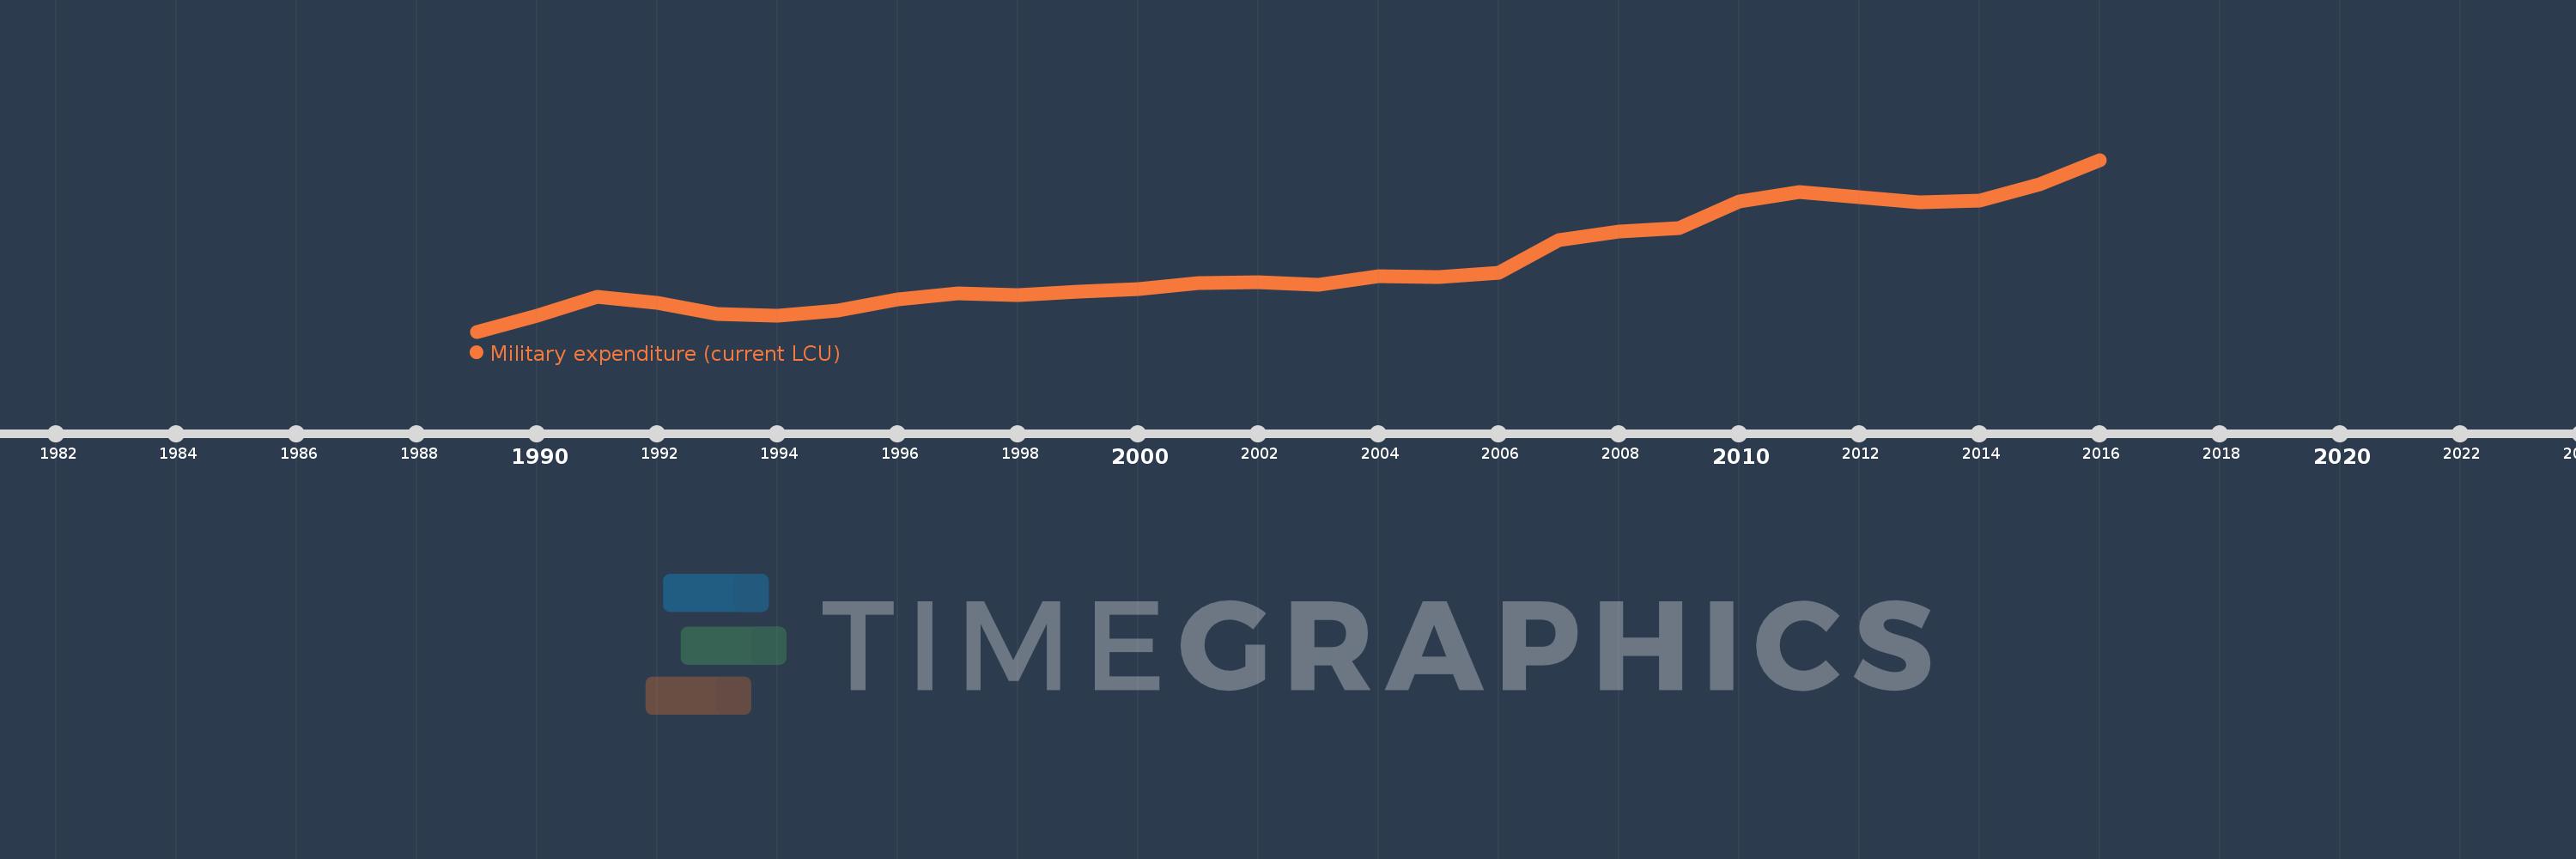
Military expenditure (current LCU)
2016,2015,2014,2013,2012,2011,2010,2009,2008,2007,2006,2005,2004,2003,2002,2001,2000,1999,1998,1997,1996,1995,1994,1993,1992,1991,1990,1989
Cette statistique dans les autres pays:
AfghanistanAlbaniaAlgeriaAngolaArgentinaArmeniaAustraliaAustriaAzerbaijanBahrainBangladeshBelarusBelgiumBelizeBeninBoliviaBosnia and HerzegovinaBotswanaBrazilBrunei DarussalamBulgariaBurkina FasoBurundiCabo VerdeCambodiaCameroonCanadaCentral African RepublicChadChileChinaColombiaCongo, Dem. Rep.Congo, Rep.Costa RicaCote d'IvoireCroatiaCubaCyprusCzech RepublicDenmarkDjiboutiDominican RepublicEcuadorEgypt, Arab Rep.El SalvadorEquatorial GuineaEritreaEstoniaEthiopiaFijiFinlandFranceGabonGambia, TheGeorgiaGermanyGhanaGreeceGuatemalaGuineaGuinea-BissauGuyanaHaitiHondurasHungaryIcelandIndiaIndonesiaIran, Islamic Rep.IraqIrelandIsraelItalyJamaicaJapanJordanKazakhstanKenyaKorea, Dem. People’s Rep.Korea, Rep.KosovoKuwaitKyrgyz RepublicLao PDRLatviaLebanonLesothoLiberiaLibyaLithuaniaLuxembourgMacedonia, FYRMadagascarMalawiMalaysiaMaliMaltaMauritaniaMauritiusMexicoMoldovaMongoliaMontenegroMoroccoMozambiqueMyanmarNamibiaNepalNetherlandsNew ZealandNicaraguaNigerNigeriaNorwayOmanPakistanPanamaPapua New GuineaParaguayPeruPhilippinesPolandPortugalQatarRomaniaRussian FederationRwandaSaudi ArabiaSenegalSerbiaSeychellesSierra LeoneSingaporeSlovak RepublicSloveniaSomaliaSouth AfricaSouth SudanSpainSri LankaSudanSwazilandSwedenSwitzerlandSyrian Arab RepublicTajikistanTanzaniaThailandTimor-LesteTogoTrinidad and TobagoTunisiaTurkeyTurkmenistanUgandaUkraineUnited Arab EmiratesUnited KingdomUnited StatesUruguayUzbekistanVenezuela, RBVietnamYemen, Rep.ZambiaZimbabwe La ligne de temps
Cette échelle de temps montre un graphique de 1989 année à 2016 année New Zealand. Les données jusqu'à 1988 année ne sont pas présentés. Quantité d'observations actuelles selon dates: 28.
Source (désignation):
Les indicateurs du développement mondiale
Source (organisation):
Stockholm International Peace Research Institute (SIPRI), Yearbook: Armaments, Disarmament and International Security.
Catégories:
Public Sector
Dernière mise à jour
23 avr. 2017
Les indicateurs de changement de valeurs selon les années
Minimum:
1.468 mds
1 janv. 1989
Maximum:
2.955 mds
1 janv. 2016
Pour la date d''observation
Valeur
Changement absolu
Le changement par rapport à la valeur précédente
1 janv. 1989
1.468 mds
+1.468 mds
0.0%
1 janv. 1990
1.605 mds
+136.45 mln.
9.29%
1 janv. 1991
1.773 mds
+168.4 mln.
10.49%
1 janv. 1992
1.714 mds
-58.5 mln.
-3.3%
1 janv. 1993
1.621 mds
-94.0 mln.
-5.48%
1 janv. 1994
1.604 mds
-16.5 mln.
-1.02%
1 janv. 1995
1.652 mds
+48.0 mln.
2.99%
1 janv. 1996
1.747 mds
+95.0 mln.
5.75%
1 janv. 1997
1.802 mds
+54.5 mln.
3.12%
1 janv. 1998
1.786 mds
-15.5 mln.
-0.86%
1 janv. 1999
1.811 mds
+25.0 mln.
1.4%
1 janv. 2000
1.833 mds
+22.5 mln.
1.24%
1 janv. 2001
1.889 mds
+56.0 mln.
3.05%
1 janv. 2002
1.895 mds
+5.5 mln.
0.29%
1 janv. 2003
1.872 mds
-23.0 mln.
-1.21%
1 janv. 2004
1.951 mds
+78.85 mln.
4.21%
1 janv. 2005
1.939 mds
-11.95 mln.
-0.61%
1 janv. 2006
1.974 mds
+34.95 mln.
1.8%
1 janv. 2007
2.257 mds
+283.65 mln.
14.37%
1 janv. 2008
2.332 mds
+74.7 mln.
3.31%
1 janv. 2009
2.364 mds
+31.3 mln.
1.34%
1 janv. 2010
2.598 mds
+234.75 mln.
9.93%
1 janv. 2011
2.68 mds
+81.3 mln.
3.13%
1 janv. 2012
2.633 mds
-46.55 mln.
-1.74%
1 janv. 2013
2.586 mds
-47.25 mln.
-1.79%
1 janv. 2014
2.602 mds
+16.6 mln.
0.64%
1 janv. 2015
2.743 mds
+140.85 mln.
5.41%
1 janv. 2016
2.955 mds
+212.3 mln.
7.74%
Classement des pays selon les statistiques actuelles par années


Commentaires: