29
/fr/
fr
AIzaSyAYiBZKx7MnpbEhh9jyipgxe19OcubqV5w
April 1, 2024
139543
Germany
DEU
true
2
1
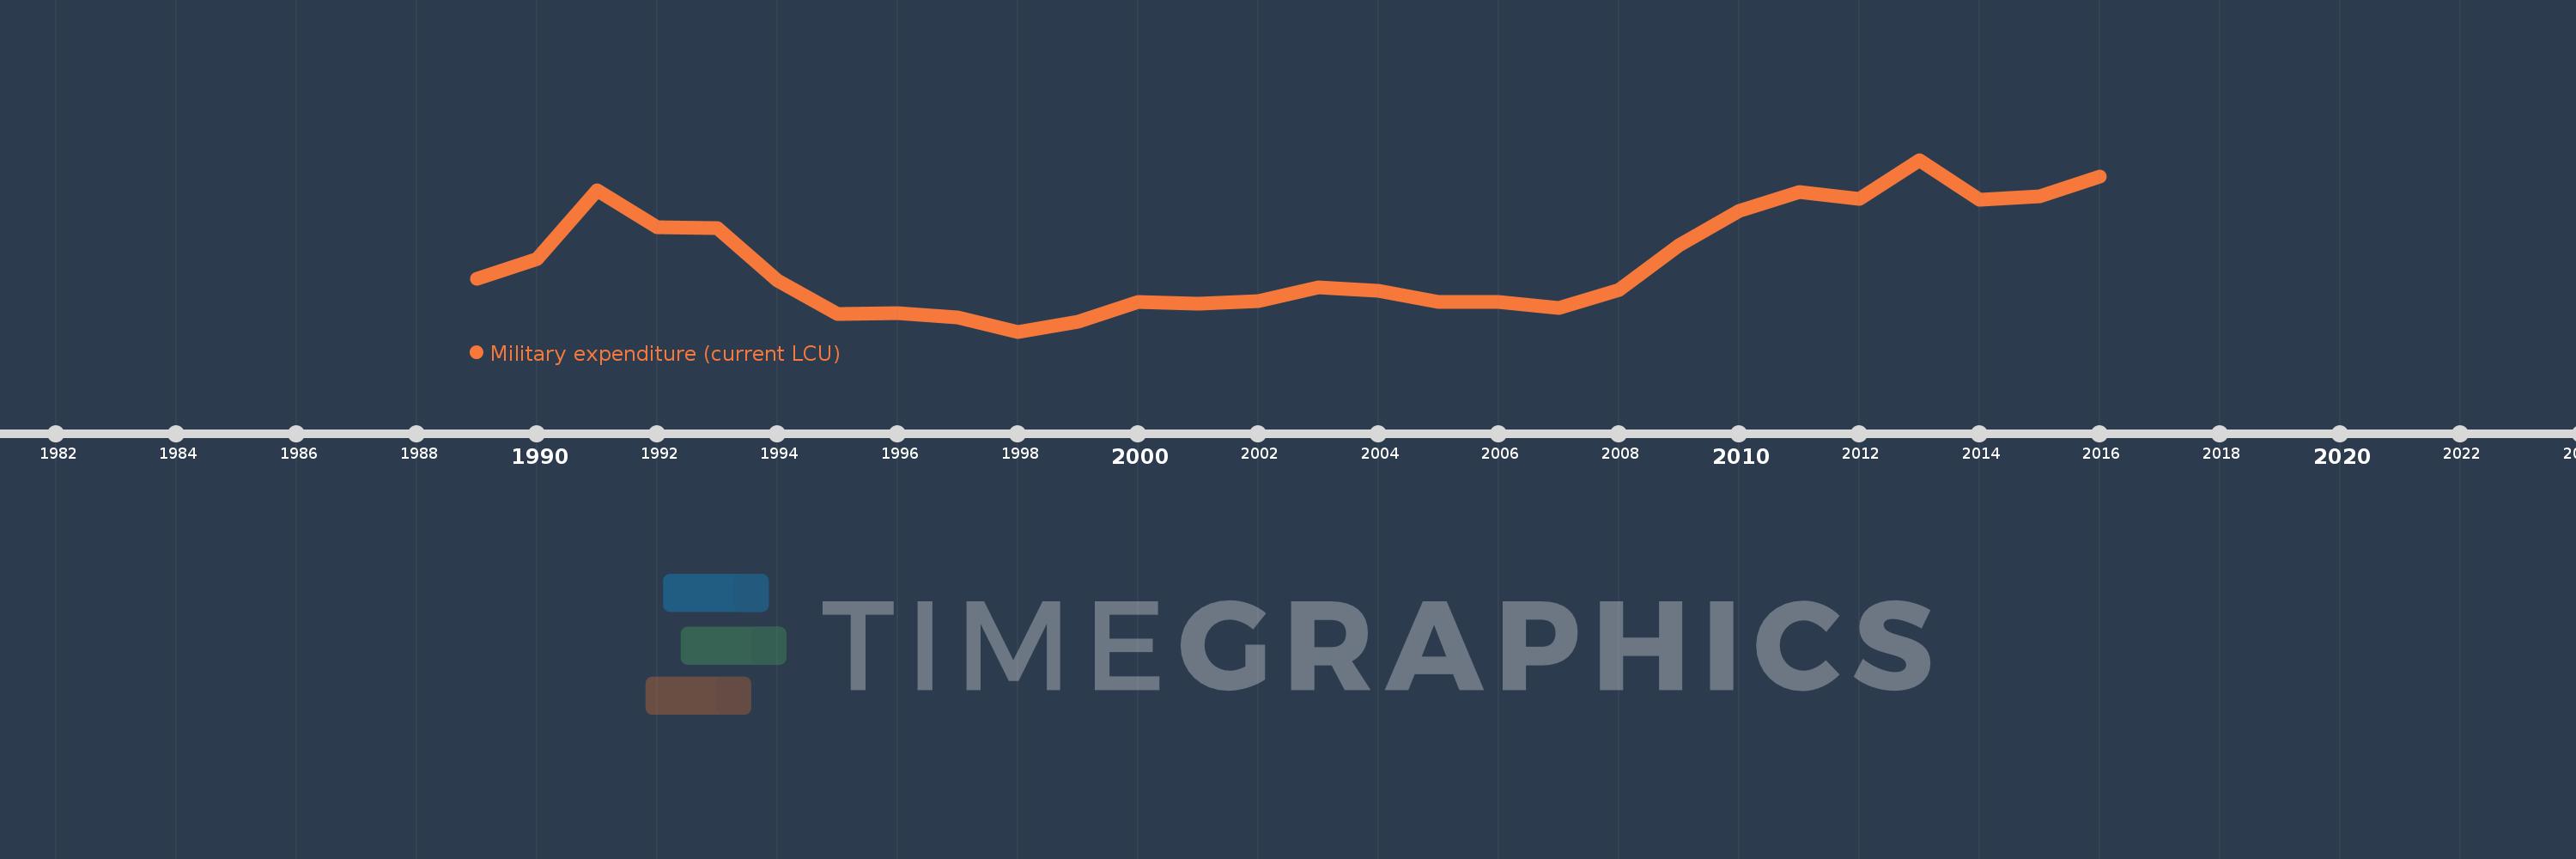
Military expenditure (current LCU)
2016,2015,2014,2013,2012,2011,2010,2009,2008,2007,2006,2005,2004,2003,2002,2001,2000,1999,1998,1997,1996,1995,1994,1993,1992,1991,1990,1989
Cette statistique dans les autres pays:
AfghanistanAlbaniaAlgeriaAngolaArgentinaArmeniaAustraliaAustriaAzerbaijanBahrainBangladeshBelarusBelgiumBelizeBeninBoliviaBosnia and HerzegovinaBotswanaBrazilBrunei DarussalamBulgariaBurkina FasoBurundiCabo VerdeCambodiaCameroonCanadaCentral African RepublicChadChileChinaColombiaCongo, Dem. Rep.Congo, Rep.Costa RicaCote d'IvoireCroatiaCubaCyprusCzech RepublicDenmarkDjiboutiDominican RepublicEcuadorEgypt, Arab Rep.El SalvadorEquatorial GuineaEritreaEstoniaEthiopiaFijiFinlandFranceGabonGambia, TheGeorgiaGermanyGhanaGreeceGuatemalaGuineaGuinea-BissauGuyanaHaitiHondurasHungaryIcelandIndiaIndonesiaIran, Islamic Rep.IraqIrelandIsraelItalyJamaicaJapanJordanKazakhstanKenyaKorea, Dem. People’s Rep.Korea, Rep.KosovoKuwaitKyrgyz RepublicLao PDRLatviaLebanonLesothoLiberiaLibyaLithuaniaLuxembourgMacedonia, FYRMadagascarMalawiMalaysiaMaliMaltaMauritaniaMauritiusMexicoMoldovaMongoliaMontenegroMoroccoMozambiqueMyanmarNamibiaNepalNetherlandsNew ZealandNicaraguaNigerNigeriaNorwayOmanPakistanPanamaPapua New GuineaParaguayPeruPhilippinesPolandPortugalQatarRomaniaRussian FederationRwandaSaudi ArabiaSenegalSerbiaSeychellesSierra LeoneSingaporeSlovak RepublicSloveniaSomaliaSouth AfricaSouth SudanSpainSri LankaSudanSwazilandSwedenSwitzerlandSyrian Arab RepublicTajikistanTanzaniaThailandTimor-LesteTogoTrinidad and TobagoTunisiaTurkeyTurkmenistanUgandaUkraineUnited Arab EmiratesUnited KingdomUnited StatesUruguayUzbekistanVenezuela, RBVietnamYemen, Rep.ZambiaZimbabwe La ligne de temps
Cette échelle de temps montre un graphique de 1989 année à 2016 année Germany. Les données jusqu'à 1988 année ne sont pas présentés. Quantité d'observations actuelles selon dates: 28.
Source (désignation):
Les indicateurs du développement mondiale
Source (organisation):
Stockholm International Peace Research Institute (SIPRI), Yearbook: Armaments, Disarmament and International Security.
Catégories:
Public Sector
Dernière mise à jour
23 avr. 2017
Les indicateurs de changement de valeurs selon les années
Minimum:
29.451 mds
1 janv. 1998
Maximum:
36.168 mds
1 janv. 2013
Pour la date d''observation
Valeur
Changement absolu
Le changement par rapport à la valeur précédente
1 janv. 1989
31.515 mds
+31.515 mds
0.0%
1 janv. 1990
32.302 mds
+787.0 mln.
2.5%
1 janv. 1991
34.96 mds
+2.658 mds
8.23%
1 janv. 1992
33.53 mds
-1.43 mds
-4.09%
1 janv. 1993
33.508 mds
-22.0 mln.
-0.07%
1 janv. 1994
31.459 mds
-2.049 mds
-6.11%
1 janv. 1995
30.144 mds
-1.315 mds
-4.18%
1 janv. 1996
30.159 mds
+15.0 mln.
0.05%
1 janv. 1997
29.998 mds
-161.0 mln.
-0.53%
1 janv. 1998
29.451 mds
-547.0 mln.
-1.82%
1 janv. 1999
29.822 mds
+371.0 mln.
1.26%
1 janv. 2000
30.603 mds
+781.0 mln.
2.62%
1 janv. 2001
30.554 mds
-49.0 mln.
-0.16%
1 janv. 2002
30.648 mds
+94.0 mln.
0.31%
1 janv. 2003
31.168 mds
+520.0 mln.
1.7%
1 janv. 2004
31.06 mds
-108.0 mln.
-0.35%
1 janv. 2005
30.61 mds
-450.0 mln.
-1.45%
1 janv. 2006
30.6 mds
-10.0 mln.
-0.03%
1 janv. 2007
30.365 mds
-235.0 mln.
-0.77%
1 janv. 2008
31.09 mds
+725.0 mln.
2.39%
1 janv. 2009
32.824 mds
+1.734 mds
5.58%
1 janv. 2010
34.171 mds
+1.347 mds
4.1%
1 janv. 2011
34.925 mds
+754.0 mln.
2.21%
1 janv. 2012
34.63 mds
-295.0 mln.
-0.84%
1 janv. 2013
36.168 mds
+1.538 mds
4.44%
1 janv. 2014
34.593 mds
-1.575 mds
-4.35%
1 janv. 2015
34.749 mds
+156.0 mln.
0.45%
1 janv. 2016
35.517 mds
+768.0 mln.
2.21%
Classement des pays selon les statistiques actuelles par années


Commentaires: