29
/fr/
fr
AIzaSyAYiBZKx7MnpbEhh9jyipgxe19OcubqV5w
April 1, 2024
209327
New Zealand
NZL
true
2
1
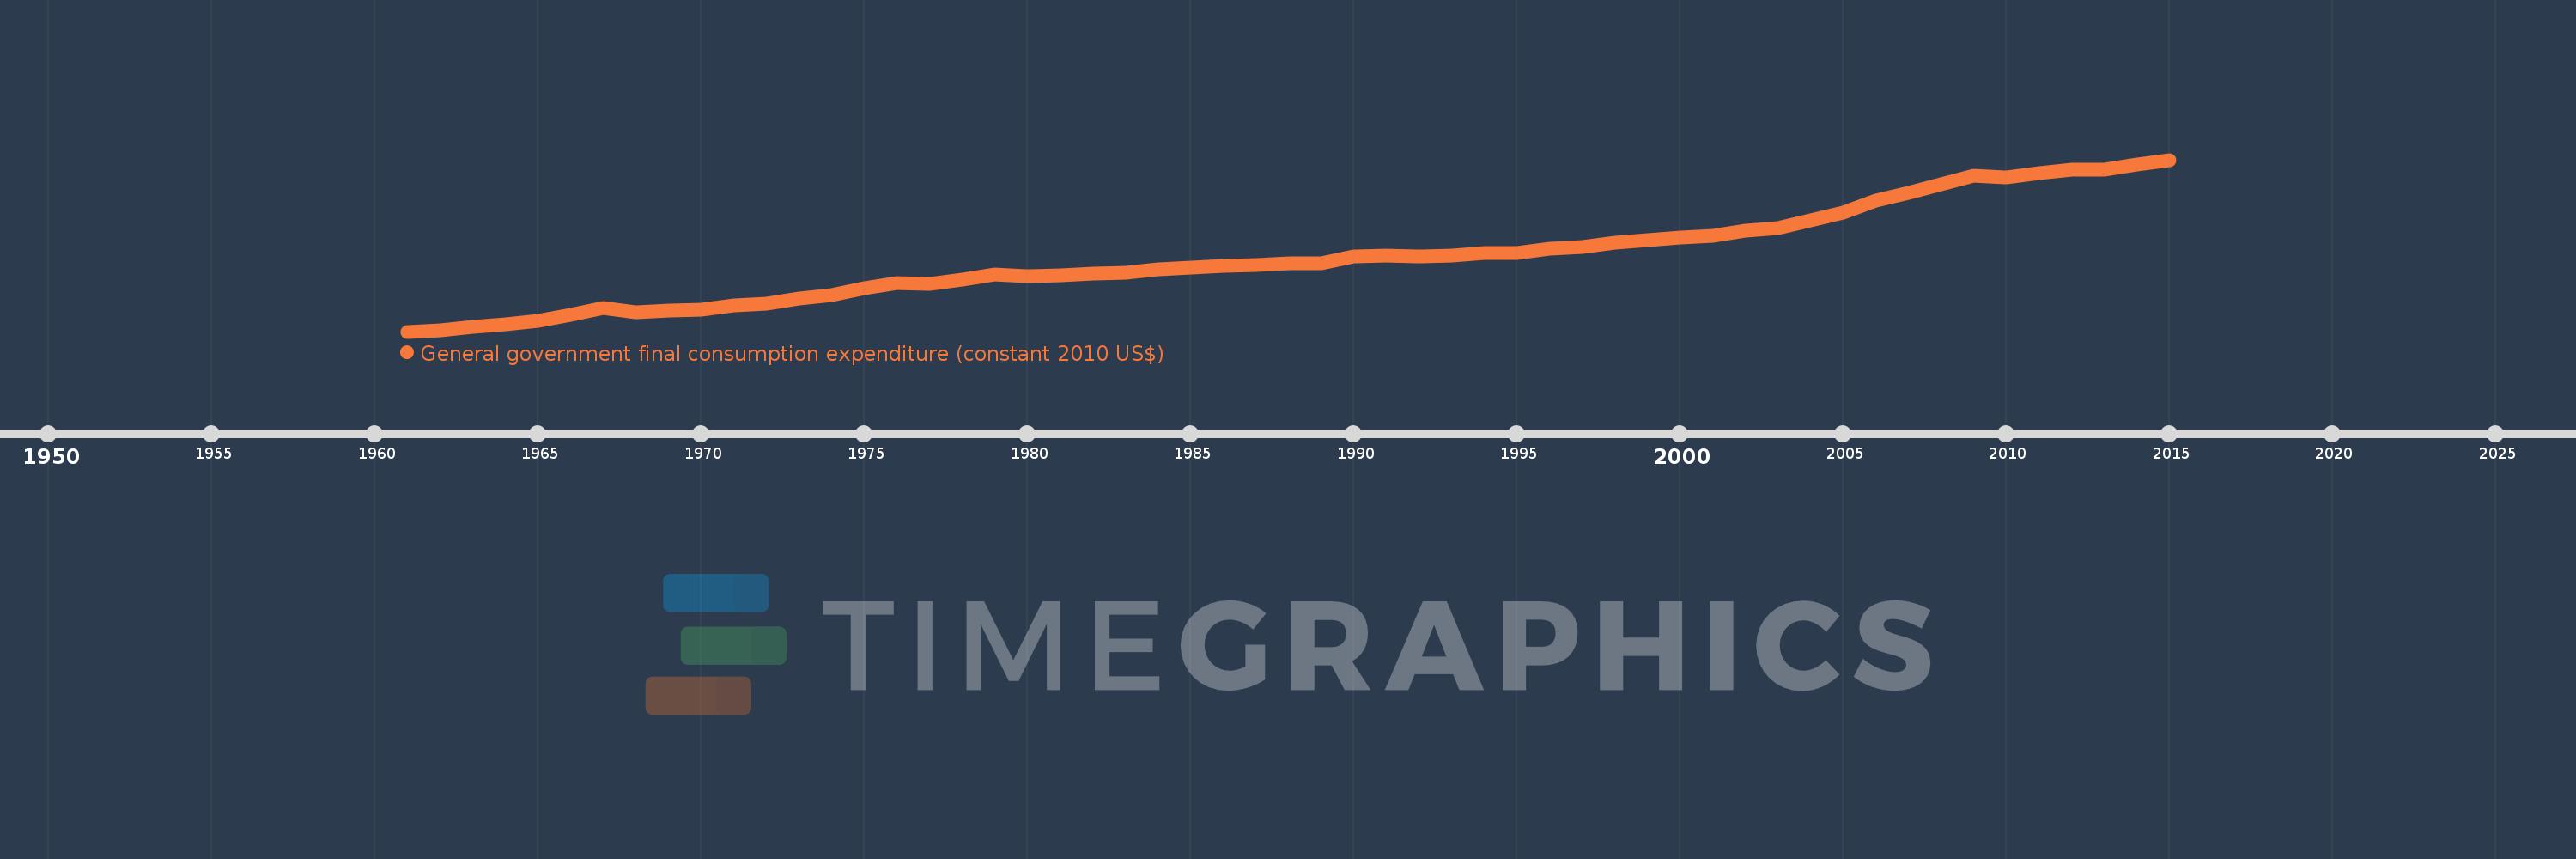
General government final consumption expenditure (constant 2010 US$)
2015,2014,2013,2012,2011,2010,2009,2008,2007,2006,2005,2004,2003,2002,2001,2000,1999,1998,1997,1996,1995,1994,1993,1992,1991,1990,1989,1988,1987,1986,1985,1984,1983,1982,1981,1980,1979,1978,1977,1976,1975,1974,1973,1972,1971,1970,1969,1968,1967,1966,1965,1964,1963,1962,1961
Cette statistique dans les autres pays:
AfghanistanAlbaniaAlgeriaAngolaAntigua and BarbudaArab WorldArgentinaArmeniaArubaAustraliaAustriaAzerbaijanBahamas, TheBahrainBangladeshBarbadosBelarusBelgiumBelizeBeninBermudaBhutanBoliviaBosnia and HerzegovinaBotswanaBrazilBrunei DarussalamBulgariaBurkina FasoBurundiCabo VerdeCambodiaCameroonCanadaCaribbean small statesCentral African RepublicCentral Europe and the BalticsChadChileChinaColombiaComorosCongo, Dem. Rep.Congo, Rep.Costa RicaCote d'IvoireCroatiaCubaCyprusCzech RepublicDenmarkDominicaDominican RepublicEarly-demographic dividendEast Asia & PacificEast Asia & Pacific (excluding high income)East Asia & Pacific (IDA & IBRD countries)EcuadorEgypt, Arab Rep.El SalvadorEquatorial GuineaEritreaEstoniaEuro areaEurope & Central AsiaEurope & Central Asia (excluding high income)Europe & Central Asia (IDA & IBRD countries)European UnionFaroe IslandsFinlandFragile and conflict affected situationsFranceGabonGambia, TheGeorgiaGermanyGhanaGreeceGrenadaGuatemalaGuineaGuinea-BissauGuyanaHaitiHeavily indebted poor countries (HIPC)High incomeHondurasHong Kong SAR, ChinaHungaryIBRD onlyIcelandIDA & IBRD totalIDA blendIDA onlyIDA totalIndiaIndonesiaIran, Islamic Rep.IraqIrelandIsraelItalyJamaicaJapanJordanKazakhstanKenyaKorea, Rep.KosovoKuwaitKyrgyz RepublicLao PDRLate-demographic dividendLatin America & Caribbean Latin America & Caribbean (excluding high income)Latin America & the Caribbean (IDA & IBRD countries)LatviaLeast developed countries: UN classificationLebanonLiberiaLithuaniaLow & middle incomeLow incomeLower middle incomeLuxembourgMacao SAR, ChinaMacedonia, FYRMadagascarMalawiMalaysiaMaliMaltaMauritaniaMauritiusMexicoMiddle East & North AfricaMiddle East & North Africa (excluding high income)Middle East & North Africa (IDA & IBRD countries)Middle incomeMoldovaMongoliaMontenegroMoroccoMozambiqueNamibiaNepalNetherlandsNew ZealandNicaraguaNigerNigeriaNorth AmericaNorwayOECD membersOmanOther small statesPakistanPanamaParaguayPeruPhilippinesPolandPortugalPost-demographic dividendPre-demographic dividendPuerto RicoQatarRomaniaRussian FederationRwandaSaudi ArabiaSenegalSerbiaSeychellesSierra LeoneSingaporeSlovak RepublicSloveniaSmall statesSouth AfricaSouth AsiaSouth Asia (IDA & IBRD)South SudanSpainSri LankaSt. Kitts and NevisSt. LuciaSt. Vincent and the GrenadinesSub-Saharan Africa Sub-Saharan Africa (excluding high income)Sub-Saharan Africa (IDA & IBRD countries)SudanSurinameSwazilandSwedenSwitzerlandTajikistanTanzaniaThailandTimor-LesteTogoTongaTrinidad and TobagoTunisiaTurkeyTurkmenistanUgandaUkraineUnited Arab EmiratesUnited KingdomUnited StatesUpper middle incomeUruguayUzbekistanVanuatuVenezuela, RBVietnamWest Bank and GazaWorldYemen, Rep.ZambiaZimbabwe La ligne de temps
Cette échelle de temps montre un graphique de 1961 année à 2015 année New Zealand. Les données jusqu'à 1960 année ne sont pas présentés. Quantité d'observations actuelles selon dates: 55.
Source (désignation):
Les indicateurs du développement mondiale
Source (organisation):
World Bank national accounts data, and OECD National Accounts data files.
Catégories:
Economy & Growth
Dernière mise à jour
23 avr. 2017
Les indicateurs de changement de valeurs selon les années
Minimum:
7.181 mds
1 janv. 1961
Maximum:
30.47 mds
1 janv. 2015
Pour la date d''observation
Valeur
Changement absolu
Le changement par rapport à la valeur précédente
1 janv. 1961
7.181 mds
+7.181 mds
0.0%
1 janv. 1962
7.403 mds
+222.136 mln.
3.09%
1 janv. 1963
7.826 mds
+422.423 mln.
5.71%
1 janv. 1964
8.123 mds
+296.788 mln.
3.79%
1 janv. 1965
8.654 mds
+531.67 mln.
6.55%
1 janv. 1966
9.395 mds
+741.061 mln.
8.56%
1 janv. 1967
10.345 mds
+949.856 mln.
10.11%
1 janv. 1968
9.841 mds
-504.571 mln.
-4.88%
1 janv. 1969
10.068 mds
+227.477 mln.
2.31%
1 janv. 1970
10.13 mds
+62.032 mln.
0.62%
1 janv. 1971
10.723 mds
+592.467 mln.
5.85%
1 janv. 1972
10.981 mds
+258.104 mln.
2.41%
1 janv. 1973
11.648 mds
+667.703 mln.
6.08%
1 janv. 1974
12.12 mds
+471.32 mln.
4.05%
1 janv. 1975
13.12 mds
+1.0 mds
8.25%
1 janv. 1976
13.761 mds
+641.051 mln.
4.89%
1 janv. 1977
13.654 mds
-106.608 mln.
-0.77%
1 janv. 1978
14.21 mds
+555.484 mln.
4.07%
1 janv. 1979
14.872 mds
+662.092 mln.
4.66%
1 janv. 1980
14.675 mds
-196.383 mln.
-1.32%
1 janv. 1981
14.81 mds
+134.663 mln.
0.92%
1 janv. 1982
15.082 mds
+272.131 mln.
1.84%
1 janv. 1983
15.166 mds
+84.164 mln.
0.56%
1 janv. 1984
15.58 mds
+413.808 mln.
2.73%
1 janv. 1985
15.864 mds
+283.353 mln.
1.82%
1 janv. 1986
16.138 mds
+274.937 mln.
1.73%
1 janv. 1987
16.248 mds
+109.414 mln.
0.68%
1 janv. 1988
16.46 mds
+212.195 mln.
1.31%
1 janv. 1989
16.46 mds
0.0
0.0%
1 janv. 1990
17.331 mds
+870.936 mln.
5.29%
1 janv. 1991
17.515 mds
+183.471 mln.
1.06%
1 janv. 1992
17.341 mds
-173.893 mln.
-0.99%
1 janv. 1993
17.54 mds
+198.945 mln.
1.15%
1 janv. 1994
17.822 mds
+282.207 mln.
1.61%
1 janv. 1995
17.8 mds
-22.105 mln.
-0.12%
1 janv. 1996
18.452 mds
+652.097 mln.
3.66%
1 janv. 1997
18.685 mds
+233.576 mln.
1.27%
1 janv. 1998
19.264 mds
+579.151 mln.
3.1%
1 janv. 1999
19.573 mds
+308.733 mln.
1.6%
1 janv. 2000
19.925 mds
+351.469 mln.
1.8%
1 janv. 2001
20.113 mds
+188.629 mln.
0.95%
1 janv. 2002
20.896 mds
+782.516 mln.
3.89%
1 janv. 2003
21.247 mds
+350.732 mln.
1.68%
1 janv. 2004
22.244 mds
+996.935 mln.
4.69%
1 janv. 2005
23.307 mds
+1.064 mds
4.78%
1 janv. 2006
24.976 mds
+1.668 mds
7.16%
1 janv. 2007
25.952 mds
+976.303 mln.
3.91%
1 janv. 2008
27.19 mds
+1.238 mds
4.77%
1 janv. 2009
28.259 mds
+1.069 mds
3.93%
1 janv. 2010
28.12 mds
-138.524 mln.
-0.49%
1 janv. 2011
28.655 mds
+534.941 mln.
1.9%
1 janv. 2012
29.159 mds
+503.257 mln.
1.76%
1 janv. 2013
29.123 mds
-35.368 mln.
-0.12%
1 janv. 2014
29.776 mds
+652.834 mln.
2.24%
1 janv. 2015
30.47 mds
+694.096 mln.
2.33%
Classement des pays selon les statistiques actuelles par années


Commentaires: