29
/fr/
fr
AIzaSyAYiBZKx7MnpbEhh9jyipgxe19OcubqV5w
April 1, 2024
127358
Equatorial Guinea
GNQ
true
2
1
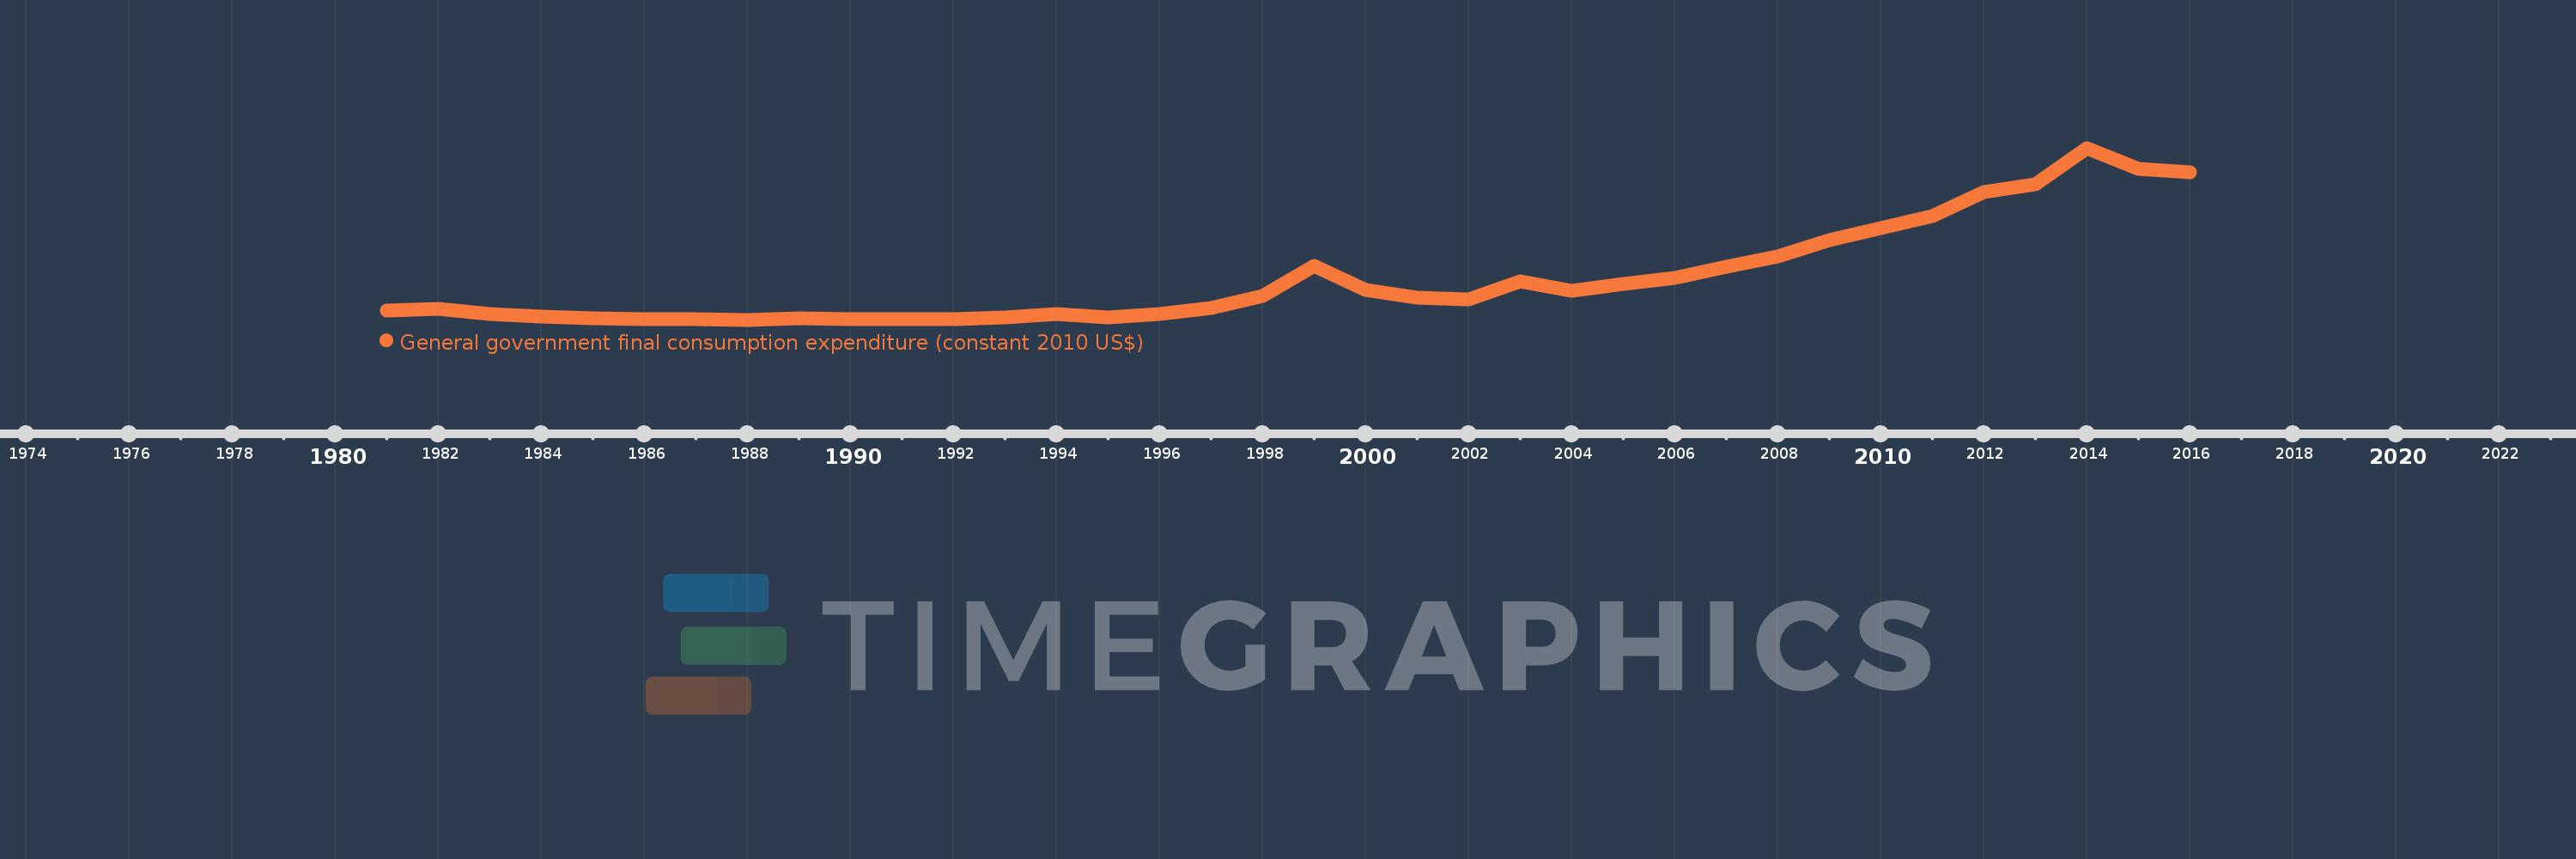
General government final consumption expenditure (constant 2010 US$)
2016,2015,2014,2013,2012,2011,2010,2009,2008,2007,2006,2005,2004,2003,2002,2001,2000,1999,1998,1997,1996,1995,1994,1993,1992,1991,1990,1989,1988,1987,1986,1985,1984,1983,1982,1981
Cette statistique dans les autres pays:
AfghanistanAlbaniaAlgeriaAngolaAntigua and BarbudaArab WorldArgentinaArmeniaArubaAustraliaAustriaAzerbaijanBahamas, TheBahrainBangladeshBarbadosBelarusBelgiumBelizeBeninBermudaBhutanBoliviaBosnia and HerzegovinaBotswanaBrazilBrunei DarussalamBulgariaBurkina FasoBurundiCabo VerdeCambodiaCameroonCanadaCaribbean small statesCentral African RepublicCentral Europe and the BalticsChadChileChinaColombiaComorosCongo, Dem. Rep.Congo, Rep.Costa RicaCote d'IvoireCroatiaCubaCyprusCzech RepublicDenmarkDominicaDominican RepublicEarly-demographic dividendEast Asia & PacificEast Asia & Pacific (excluding high income)East Asia & Pacific (IDA & IBRD countries)EcuadorEgypt, Arab Rep.El SalvadorEquatorial GuineaEritreaEstoniaEuro areaEurope & Central AsiaEurope & Central Asia (excluding high income)Europe & Central Asia (IDA & IBRD countries)European UnionFaroe IslandsFinlandFragile and conflict affected situationsFranceGabonGambia, TheGeorgiaGermanyGhanaGreeceGrenadaGuatemalaGuineaGuinea-BissauGuyanaHaitiHeavily indebted poor countries (HIPC)High incomeHondurasHong Kong SAR, ChinaHungaryIBRD onlyIcelandIDA & IBRD totalIDA blendIDA onlyIDA totalIndiaIndonesiaIran, Islamic Rep.IraqIrelandIsraelItalyJamaicaJapanJordanKazakhstanKenyaKorea, Rep.KosovoKuwaitKyrgyz RepublicLao PDRLate-demographic dividendLatin America & Caribbean Latin America & Caribbean (excluding high income)Latin America & the Caribbean (IDA & IBRD countries)LatviaLeast developed countries: UN classificationLebanonLiberiaLithuaniaLow & middle incomeLow incomeLower middle incomeLuxembourgMacao SAR, ChinaMacedonia, FYRMadagascarMalawiMalaysiaMaliMaltaMauritaniaMauritiusMexicoMiddle East & North AfricaMiddle East & North Africa (excluding high income)Middle East & North Africa (IDA & IBRD countries)Middle incomeMoldovaMongoliaMontenegroMoroccoMozambiqueNamibiaNepalNetherlandsNew ZealandNicaraguaNigerNigeriaNorth AmericaNorwayOECD membersOmanOther small statesPakistanPanamaParaguayPeruPhilippinesPolandPortugalPost-demographic dividendPre-demographic dividendPuerto RicoQatarRomaniaRussian FederationRwandaSaudi ArabiaSenegalSerbiaSeychellesSierra LeoneSingaporeSlovak RepublicSloveniaSmall statesSouth AfricaSouth AsiaSouth Asia (IDA & IBRD)South SudanSpainSri LankaSt. Kitts and NevisSt. LuciaSt. Vincent and the GrenadinesSub-Saharan Africa Sub-Saharan Africa (excluding high income)Sub-Saharan Africa (IDA & IBRD countries)SudanSurinameSwazilandSwedenSwitzerlandTajikistanTanzaniaThailandTimor-LesteTogoTongaTrinidad and TobagoTunisiaTurkeyTurkmenistanUgandaUkraineUnited Arab EmiratesUnited KingdomUnited StatesUpper middle incomeUruguayUzbekistanVanuatuVenezuela, RBVietnamWest Bank and GazaWorldYemen, Rep.ZambiaZimbabwe La ligne de temps
Cette échelle de temps montre un graphique de 1981 année à 2016 année Equatorial Guinea. Les données jusqu'à 1980 année ne sont pas présentés. Quantité d'observations actuelles selon dates: 36.
Source (désignation):
Les indicateurs du développement mondiale
Source (organisation):
World Bank national accounts data, and OECD National Accounts data files.
Catégories:
Economy & Growth
Dernière mise à jour
23 avr. 2017
Les indicateurs de changement de valeurs selon les années
Minimum:
68.296 mln.
1 janv. 1988
Maximum:
3.115 mds
1 janv. 2014
Pour la date d''observation
Valeur
Changement absolu
Le changement par rapport à la valeur précédente
1 janv. 1981
226.665 mln.
+226.665 mln.
0.0%
1 janv. 1982
254.856 mln.
+28.191 mln.
12.44%
1 janv. 1983
168.875 mln.
-85.981 mln.
-33.74%
1 janv. 1984
117.063 mln.
-51.812 mln.
-30.68%
1 janv. 1985
94.378 mln.
-22.684 mln.
-19.38%
1 janv. 1986
74.844 mln.
-19.535 mln.
-20.7%
1 janv. 1987
80.872 mln.
+6.029 mln.
8.06%
1 janv. 1988
68.296 mln.
-12.576 mln.
-15.55%
1 janv. 1989
95.169 mln.
+26.873 mln.
39.35%
1 janv. 1990
75.864 mln.
-19.305 mln.
-20.29%
1 janv. 1991
73.313 mln.
-2.55 mln.
-3.36%
1 janv. 1992
74.409 mln.
+1.095 mln.
1.49%
1 janv. 1993
107.095 mln.
+32.686 mln.
43.93%
1 janv. 1994
166.232 mln.
+59.137 mln.
55.22%
1 janv. 1995
115.828 mln.
-50.404 mln.
-30.32%
1 janv. 1996
167.303 mln.
+51.475 mln.
44.44%
1 janv. 1997
281.011 mln.
+113.708 mln.
67.97%
1 janv. 1998
492.405 mln.
+211.394 mln.
75.23%
1 janv. 1999
1.024 mds
+531.513 mln.
107.94%
1 janv. 2000
604.556 mln.
-419.362 mln.
-40.96%
1 janv. 2001
460.469 mln.
-144.087 mln.
-23.83%
1 janv. 2002
429.688 mln.
-30.781 mln.
-6.68%
1 janv. 2003
741.899 mln.
+312.211 mln.
72.66%
1 janv. 2004
584.501 mln.
-157.399 mln.
-21.22%
1 janv. 2005
701.523 mln.
+117.023 mln.
20.02%
1 janv. 2006
806.114 mln.
+104.591 mln.
14.91%
1 janv. 2007
1.001 mds
+195.131 mln.
24.21%
1 janv. 2008
1.194 mds
+192.491 mln.
19.23%
1 janv. 2009
1.473 mds
+279.376 mln.
23.4%
1 janv. 2010
1.691 mds
+217.58 mln.
14.77%
1 janv. 2011
1.905 mds
+213.994 mln.
12.66%
1 janv. 2012
2.336 mds
+431.42 mln.
22.65%
1 janv. 2013
2.476 mds
+140.329 mln.
6.01%
1 janv. 2014
3.115 mds
+638.952 mln.
25.8%
1 janv. 2015
2.752 mds
-363.272 mln.
-11.66%
1 janv. 2016
2.679 mds
-73.605 mln.
-2.67%
Classement des pays selon les statistiques actuelles par années


Commentaires: