29
/fr/
fr
AIzaSyAYiBZKx7MnpbEhh9jyipgxe19OcubqV5w
April 1, 2024
209274
New Zealand
NZL
true
2
1
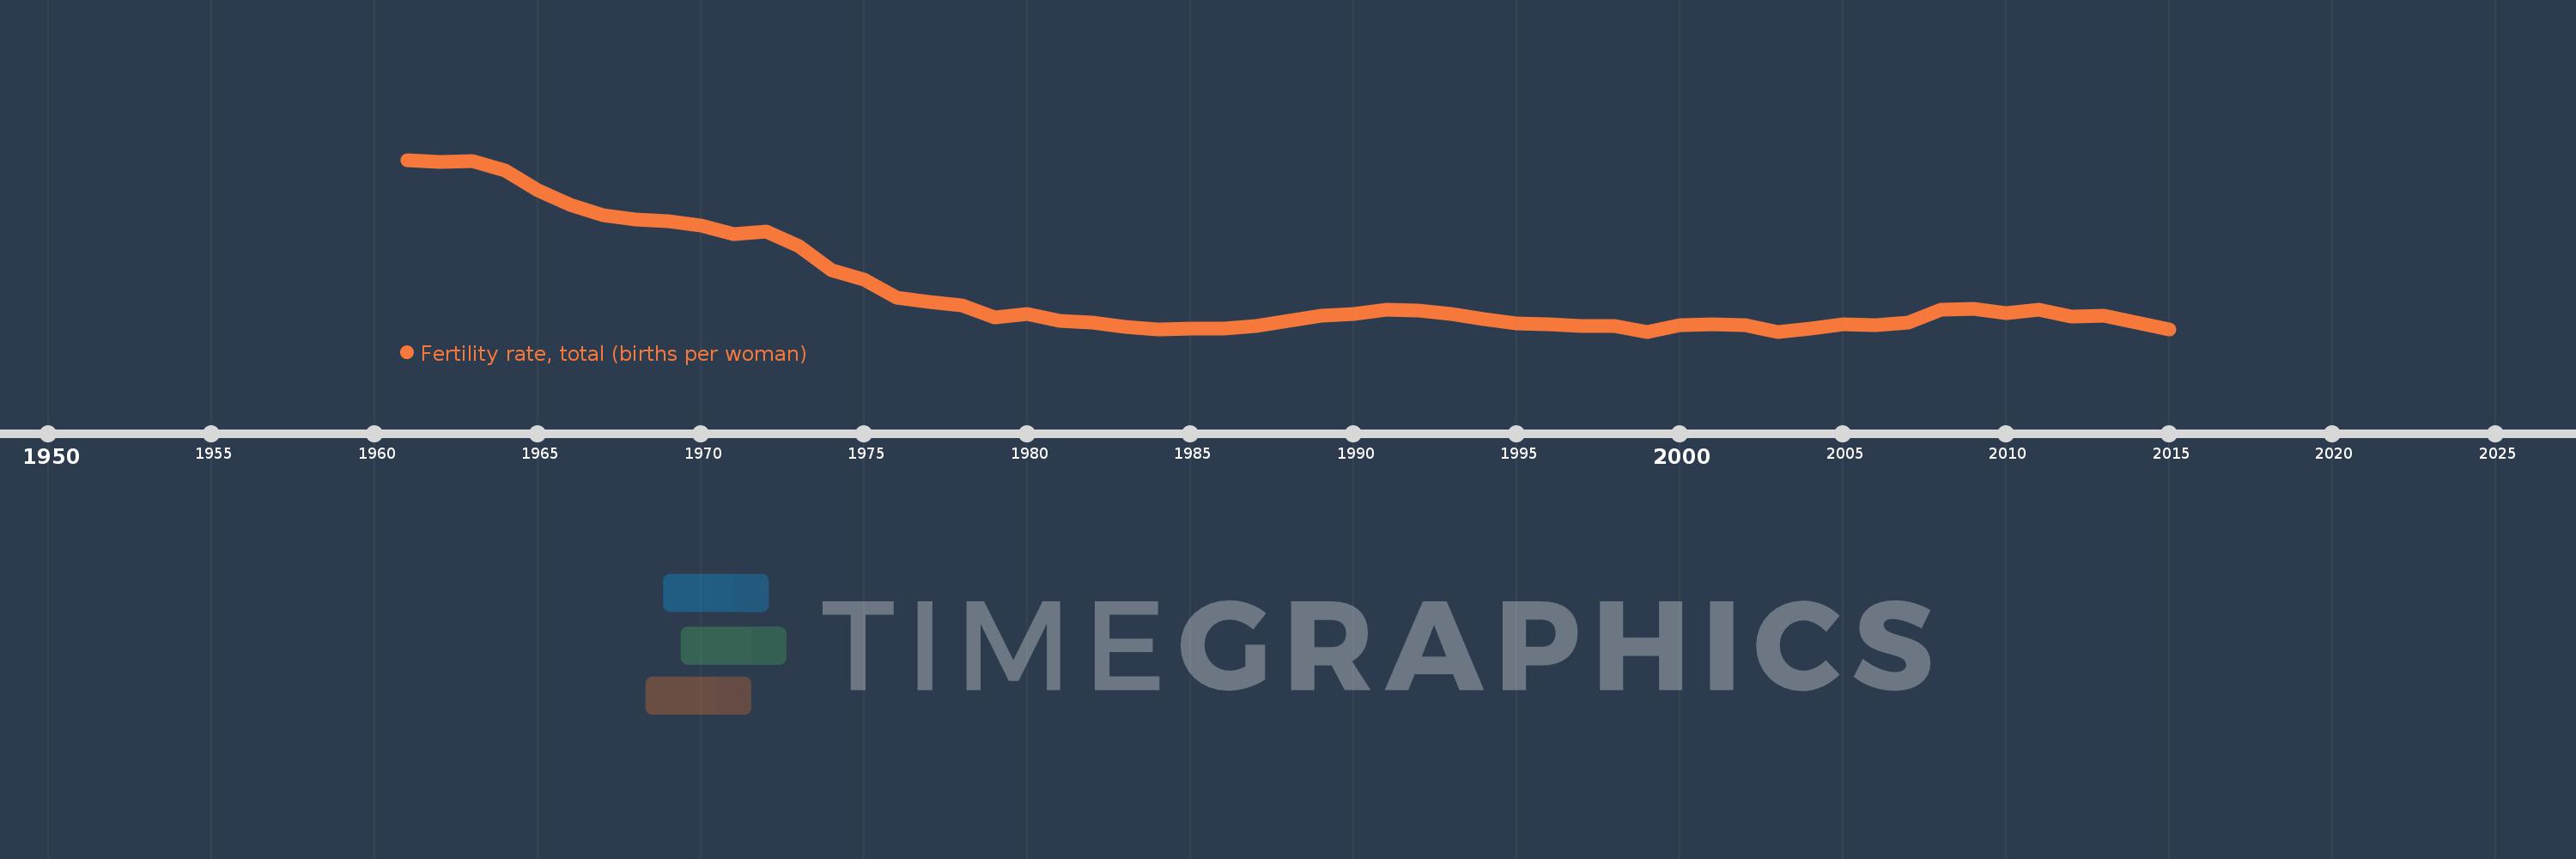
Fertility rate, total (births per woman)
2015,2014,2013,2012,2011,2010,2009,2008,2007,2006,2005,2004,2003,2002,2001,2000,1999,1998,1997,1996,1995,1994,1993,1992,1991,1990,1989,1988,1987,1986,1985,1984,1983,1982,1981,1980,1979,1978,1977,1976,1975,1974,1973,1972,1971,1970,1969,1968,1967,1966,1965,1964,1963,1962,1961
Cette statistique dans les autres pays:
AfghanistanAlbaniaAlgeriaAndorraAngolaAntigua and BarbudaArab WorldArgentinaArmeniaArubaAustraliaAustriaAzerbaijanBahamas, TheBahrainBangladeshBarbadosBelarusBelgiumBelizeBeninBermudaBhutanBoliviaBosnia and HerzegovinaBotswanaBrazilBrunei DarussalamBulgariaBurkina FasoBurundiCabo VerdeCambodiaCameroonCanadaCaribbean small statesCentral African RepublicCentral Europe and the BalticsChadChannel IslandsChileChinaColombiaComorosCongo, Dem. Rep.Congo, Rep.Costa RicaCote d'IvoireCroatiaCubaCuracaoCyprusCzech RepublicDenmarkDjiboutiDominicaDominican RepublicEarly-demographic dividendEast Asia & PacificEast Asia & Pacific (excluding high income)East Asia & Pacific (IDA & IBRD countries)EcuadorEgypt, Arab Rep.El SalvadorEquatorial GuineaEritreaEstoniaEthiopiaEuro areaEurope & Central AsiaEurope & Central Asia (excluding high income)Europe & Central Asia (IDA & IBRD countries)European UnionFaroe IslandsFijiFinlandFragile and conflict affected situationsFranceFrench PolynesiaGabonGambia, TheGeorgiaGermanyGhanaGreeceGreenlandGrenadaGuamGuatemalaGuineaGuinea-BissauGuyanaHaitiHeavily indebted poor countries (HIPC)High incomeHondurasHong Kong SAR, ChinaHungaryIBRD onlyIcelandIDA & IBRD totalIDA blendIDA onlyIDA totalIndiaIndonesiaIran, Islamic Rep.IraqIrelandIsle of ManIsraelItalyJamaicaJapanJordanKazakhstanKenyaKiribatiKorea, Dem. People’s Rep.Korea, Rep.KosovoKuwaitKyrgyz RepublicLao PDRLate-demographic dividendLatin America & Caribbean Latin America & Caribbean (excluding high income)Latin America & the Caribbean (IDA & IBRD countries)LatviaLeast developed countries: UN classificationLebanonLesothoLiberiaLibyaLiechtensteinLithuaniaLow & middle incomeLow incomeLower middle incomeLuxembourgMacao SAR, ChinaMacedonia, FYRMadagascarMalawiMalaysiaMaldivesMaliMaltaMarshall IslandsMauritaniaMauritiusMexicoMicronesia, Fed. Sts.Middle East & North AfricaMiddle East & North Africa (excluding high income)Middle East & North Africa (IDA & IBRD countries)Middle incomeMoldovaMongoliaMontenegroMoroccoMozambiqueMyanmarNamibiaNepalNetherlandsNew CaledoniaNew ZealandNicaraguaNigerNigeriaNorth AmericaNorwayOECD membersOmanOther small statesPacific island small statesPakistanPalauPanamaPapua New GuineaParaguayPeruPhilippinesPolandPortugalPost-demographic dividendPre-demographic dividendPuerto RicoQatarRomaniaRussian FederationRwandaSamoaSan MarinoSao Tome and PrincipeSaudi ArabiaSenegalSerbiaSeychellesSierra LeoneSingaporeSint Maarten (Dutch part)Slovak RepublicSloveniaSmall statesSolomon IslandsSomaliaSouth AfricaSouth AsiaSouth Asia (IDA & IBRD)South SudanSpainSri LankaSt. Kitts and NevisSt. LuciaSt. Martin (French part)St. Vincent and the GrenadinesSub-Saharan Africa Sub-Saharan Africa (excluding high income)Sub-Saharan Africa (IDA & IBRD countries)SudanSurinameSwazilandSwedenSwitzerlandSyrian Arab RepublicTajikistanTanzaniaThailandTimor-LesteTogoTongaTrinidad and TobagoTunisiaTurkeyTurkmenistanUgandaUkraineUnited Arab EmiratesUnited KingdomUnited StatesUpper middle incomeUruguayUzbekistanVanuatuVenezuela, RBVietnamVirgin Islands (U.S.)West Bank and GazaWorldYemen, Rep.ZambiaZimbabwe La ligne de temps
Cette échelle de temps montre un graphique de 1961 année à 2015 année New Zealand. Les données jusqu'à 1960 année ne sont pas présentés. Quantité d'observations actuelles selon dates: 55.
Source (désignation):
Les indicateurs du développement mondiale
Source (organisation):
(1) United Nations Population Division. World Population Prospects, (2) Census reports and other statistical publications from national statistical offices, (3) Eurostat: Demographic Statistics, (4) United Nations Statistical Division. Population and Vital Statistics Reprot (various years), (5) U.S. Census Bureau: International Database, and (6) Secretariat of the Pacific Community: Statistics and Demography Programme.
Catégories:
Health, Gender
Dernière mise à jour
23 avr. 2017
Les indicateurs de changement de valeurs selon les années
Maximum:
4.129
1 janv. 1961
Pour la date d''observation
Valeur
Changement absolu
Le changement par rapport à la valeur précédente
1 janv. 1961
4.129
+4.129
0.0%
1 janv. 1962
4.099
-0.03
-0.73%
1 janv. 1963
4.107
+0.008
0.2%
1 janv. 1964
3.989
-0.118
-2.87%
1 janv. 1965
3.733
-0.256
-6.42%
1 janv. 1966
3.54
-0.193
-5.17%
1 janv. 1967
3.41
-0.13
-3.67%
1 janv. 1968
3.354
-0.056
-1.64%
1 janv. 1969
3.332
-0.022
-0.66%
1 janv. 1970
3.269
-0.063
-1.89%
1 janv. 1971
3.158
-0.111
-3.4%
1 janv. 1972
3.194
+0.036
1.14%
1 janv. 1973
3.0
-0.194
-6.07%
1 janv. 1974
2.696
-0.304
-10.13%
1 janv. 1975
2.57
-0.126
-4.67%
1 janv. 1976
2.331
-0.239
-9.3%
1 janv. 1977
2.273
-0.058
-2.49%
1 janv. 1978
2.229
-0.044
-1.94%
1 janv. 1979
2.07
-0.159
-7.13%
1 janv. 1980
2.12
+0.05
2.42%
1 janv. 1981
2.03
-0.09
-4.25%
1 janv. 1982
2.01
-0.02
-0.99%
1 janv. 1983
1.95
-0.06
-2.99%
1 janv. 1984
1.92
-0.03
-1.54%
1 janv. 1985
1.93
+0.01
0.52%
1 janv. 1986
1.93
0.0
0.0%
1 janv. 1987
1.96
+0.03
1.55%
1 janv. 1988
2.03
+0.07
3.57%
1 janv. 1989
2.1
+0.07
3.45%
1 janv. 1990
2.12
+0.02
0.95%
1 janv. 1991
2.18
+0.06
2.83%
1 janv. 1992
2.16
-0.02
-0.92%
1 janv. 1993
2.12
-0.04
-1.85%
1 janv. 1994
2.05
-0.07
-3.3%
1 janv. 1995
2.0
-0.05
-2.44%
1 janv. 1996
1.99
-0.01
-0.5%
1 janv. 1997
1.96
-0.03
-1.51%
1 janv. 1998
1.96
0.0
0.0%
1 janv. 1999
1.89
-0.07
-3.57%
1 janv. 2000
1.97
+0.08
4.23%
1 janv. 2001
1.98
+0.01
0.51%
1 janv. 2002
1.97
-0.01
-0.51%
1 janv. 2003
1.89
-0.08
-4.06%
1 janv. 2004
1.93
+0.04
2.12%
1 janv. 2005
1.98
+0.05
2.59%
1 janv. 2006
1.97
-0.01
-0.51%
1 janv. 2007
2.01
+0.04
2.03%
1 janv. 2008
2.18
+0.17
8.46%
1 janv. 2009
2.19
+0.01
0.46%
1 janv. 2010
2.13
-0.06
-2.74%
1 janv. 2011
2.17
+0.04
1.88%
1 janv. 2012
2.09
-0.08
-3.69%
1 janv. 2013
2.1
+0.01
0.48%
1 janv. 2014
2.01
-0.09
-4.29%
1 janv. 2015
1.92
-0.09
-4.48%
Classement des pays selon les statistiques actuelles par années


Commentaires: