29
/fr/
fr
AIzaSyAYiBZKx7MnpbEhh9jyipgxe19OcubqV5w
April 1, 2024
131949
Fiji
FJI
true
2
1
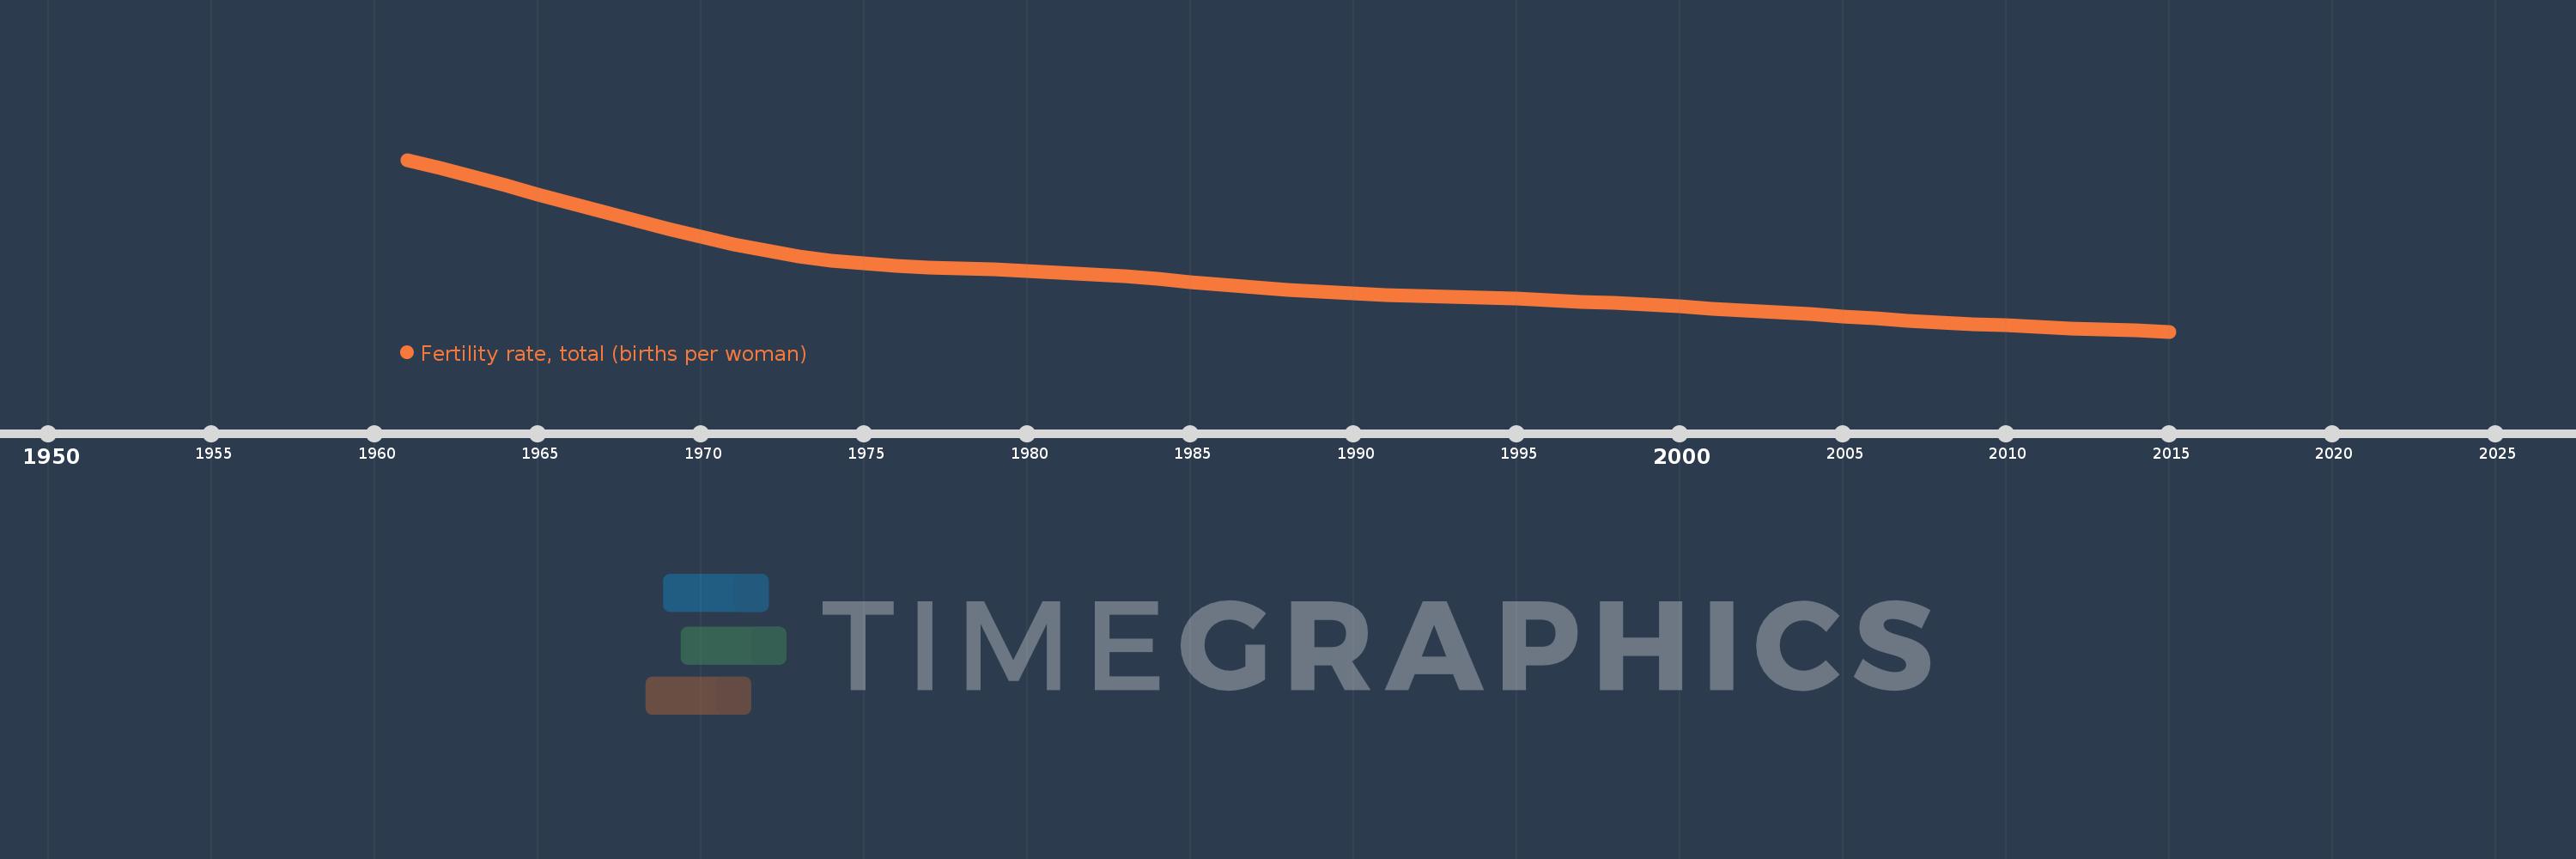
Fertility rate, total (births per woman)
2015,2014,2013,2012,2011,2010,2009,2008,2007,2006,2005,2004,2003,2002,2001,2000,1999,1998,1997,1996,1995,1994,1993,1992,1991,1990,1989,1988,1987,1986,1985,1984,1983,1982,1981,1980,1979,1978,1977,1976,1975,1974,1973,1972,1971,1970,1969,1968,1967,1966,1965,1964,1963,1962,1961
Cette statistique dans les autres pays:
AfghanistanAlbaniaAlgeriaAndorraAngolaAntigua and BarbudaArab WorldArgentinaArmeniaArubaAustraliaAustriaAzerbaijanBahamas, TheBahrainBangladeshBarbadosBelarusBelgiumBelizeBeninBermudaBhutanBoliviaBosnia and HerzegovinaBotswanaBrazilBrunei DarussalamBulgariaBurkina FasoBurundiCabo VerdeCambodiaCameroonCanadaCaribbean small statesCentral African RepublicCentral Europe and the BalticsChadChannel IslandsChileChinaColombiaComorosCongo, Dem. Rep.Congo, Rep.Costa RicaCote d'IvoireCroatiaCubaCuracaoCyprusCzech RepublicDenmarkDjiboutiDominicaDominican RepublicEarly-demographic dividendEast Asia & PacificEast Asia & Pacific (excluding high income)East Asia & Pacific (IDA & IBRD countries)EcuadorEgypt, Arab Rep.El SalvadorEquatorial GuineaEritreaEstoniaEthiopiaEuro areaEurope & Central AsiaEurope & Central Asia (excluding high income)Europe & Central Asia (IDA & IBRD countries)European UnionFaroe IslandsFijiFinlandFragile and conflict affected situationsFranceFrench PolynesiaGabonGambia, TheGeorgiaGermanyGhanaGreeceGreenlandGrenadaGuamGuatemalaGuineaGuinea-BissauGuyanaHaitiHeavily indebted poor countries (HIPC)High incomeHondurasHong Kong SAR, ChinaHungaryIBRD onlyIcelandIDA & IBRD totalIDA blendIDA onlyIDA totalIndiaIndonesiaIran, Islamic Rep.IraqIrelandIsle of ManIsraelItalyJamaicaJapanJordanKazakhstanKenyaKiribatiKorea, Dem. People’s Rep.Korea, Rep.KosovoKuwaitKyrgyz RepublicLao PDRLate-demographic dividendLatin America & Caribbean Latin America & Caribbean (excluding high income)Latin America & the Caribbean (IDA & IBRD countries)LatviaLeast developed countries: UN classificationLebanonLesothoLiberiaLibyaLiechtensteinLithuaniaLow & middle incomeLow incomeLower middle incomeLuxembourgMacao SAR, ChinaMacedonia, FYRMadagascarMalawiMalaysiaMaldivesMaliMaltaMarshall IslandsMauritaniaMauritiusMexicoMicronesia, Fed. Sts.Middle East & North AfricaMiddle East & North Africa (excluding high income)Middle East & North Africa (IDA & IBRD countries)Middle incomeMoldovaMongoliaMontenegroMoroccoMozambiqueMyanmarNamibiaNepalNetherlandsNew CaledoniaNew ZealandNicaraguaNigerNigeriaNorth AmericaNorwayOECD membersOmanOther small statesPacific island small statesPakistanPalauPanamaPapua New GuineaParaguayPeruPhilippinesPolandPortugalPost-demographic dividendPre-demographic dividendPuerto RicoQatarRomaniaRussian FederationRwandaSamoaSan MarinoSao Tome and PrincipeSaudi ArabiaSenegalSerbiaSeychellesSierra LeoneSingaporeSint Maarten (Dutch part)Slovak RepublicSloveniaSmall statesSolomon IslandsSomaliaSouth AfricaSouth AsiaSouth Asia (IDA & IBRD)South SudanSpainSri LankaSt. Kitts and NevisSt. LuciaSt. Martin (French part)St. Vincent and the GrenadinesSub-Saharan Africa Sub-Saharan Africa (excluding high income)Sub-Saharan Africa (IDA & IBRD countries)SudanSurinameSwazilandSwedenSwitzerlandSyrian Arab RepublicTajikistanTanzaniaThailandTimor-LesteTogoTongaTrinidad and TobagoTunisiaTurkeyTurkmenistanUgandaUkraineUnited Arab EmiratesUnited KingdomUnited StatesUpper middle incomeUruguayUzbekistanVanuatuVenezuela, RBVietnamVirgin Islands (U.S.)West Bank and GazaWorldYemen, Rep.ZambiaZimbabwe La ligne de temps
Cette échelle de temps montre un graphique de 1961 année à 2015 année Fiji. Les données jusqu'à 1960 année ne sont pas présentés. Quantité d'observations actuelles selon dates: 55.
Source (désignation):
Les indicateurs du développement mondiale
Source (organisation):
(1) United Nations Population Division. World Population Prospects, (2) Census reports and other statistical publications from national statistical offices, (3) Eurostat: Demographic Statistics, (4) United Nations Statistical Division. Population and Vital Statistics Reprot (various years), (5) U.S. Census Bureau: International Database, and (6) Secretariat of the Pacific Community: Statistics and Demography Programme.
Catégories:
Health, Gender
Dernière mise à jour
23 avr. 2017
Les indicateurs de changement de valeurs selon les années
Minimum:
2.564
1 janv. 2015
Maximum:
6.461
1 janv. 1961
Pour la date d''observation
Valeur
Changement absolu
Le changement par rapport à la valeur précédente
1 janv. 1961
6.461
+6.461
0.0%
1 janv. 1962
6.281
-0.18
-2.79%
1 janv. 1963
6.085
-0.196
-3.12%
1 janv. 1964
5.881
-0.204
-3.35%
1 janv. 1965
5.676
-0.205
-3.49%
1 janv. 1966
5.475
-0.201
-3.54%
1 janv. 1967
5.278
-0.197
-3.6%
1 janv. 1968
5.083
-0.195
-3.69%
1 janv. 1969
4.892
-0.191
-3.76%
1 janv. 1970
4.71
-0.182
-3.72%
1 janv. 1971
4.543
-0.167
-3.55%
1 janv. 1972
4.397
-0.146
-3.21%
1 janv. 1973
4.275
-0.122
-2.77%
1 janv. 1974
4.178
-0.097
-2.27%
1 janv. 1975
4.106
-0.072
-1.72%
1 janv. 1976
4.054
-0.052
-1.27%
1 janv. 1977
4.018
-0.036
-0.89%
1 janv. 1978
3.992
-0.026
-0.65%
1 janv. 1979
3.968
-0.024
-0.6%
1 janv. 1980
3.941
-0.027
-0.68%
1 janv. 1981
3.907
-0.034
-0.86%
1 janv. 1982
3.864
-0.043
-1.1%
1 janv. 1983
3.813
-0.051
-1.32%
1 janv. 1984
3.755
-0.058
-1.52%
1 janv. 1985
3.693
-0.062
-1.65%
1 janv. 1986
3.629
-0.064
-1.73%
1 janv. 1987
3.568
-0.061
-1.68%
1 janv. 1988
3.512
-0.056
-1.57%
1 janv. 1989
3.465
-0.047
-1.34%
1 janv. 1990
3.427
-0.038
-1.1%
1 janv. 1991
3.398
-0.029
-0.85%
1 janv. 1992
3.374
-0.024
-0.71%
1 janv. 1993
3.352
-0.022
-0.65%
1 janv. 1994
3.33
-0.022
-0.66%
1 janv. 1995
3.305
-0.025
-0.75%
1 janv. 1996
3.276
-0.029
-0.88%
1 janv. 1997
3.244
-0.032
-0.98%
1 janv. 1998
3.209
-0.035
-1.08%
1 janv. 1999
3.171
-0.038
-1.18%
1 janv. 2000
3.132
-0.039
-1.23%
1 janv. 2001
3.09
-0.042
-1.34%
1 janv. 2002
3.046
-0.044
-1.42%
1 janv. 2003
3.001
-0.045
-1.48%
1 janv. 2004
2.954
-0.047
-1.57%
1 janv. 2005
2.907
-0.047
-1.59%
1 janv. 2006
2.86
-0.047
-1.62%
1 janv. 2007
2.816
-0.044
-1.54%
1 janv. 2008
2.774
-0.042
-1.49%
1 janv. 2009
2.736
-0.038
-1.37%
1 janv. 2010
2.701
-0.035
-1.28%
1 janv. 2011
2.669
-0.032
-1.18%
1 janv. 2012
2.641
-0.028
-1.05%
1 janv. 2013
2.615
-0.026
-0.98%
1 janv. 2014
2.589
-0.026
-0.99%
1 janv. 2015
2.564
-0.025
-0.97%
Classement des pays selon les statistiques actuelles par années


Commentaires: